

A nested case control study starts with a defined cohort. When a case occurs, the team draws controls from people still at risk at that time. The time at which each control is chosen gives the design its meaning.
To read one, build a cohort-risk-set-matching evidence note. Keep each rule beside its source passage. The example below shows how age, birth interval and past exposure shape the matched sets in a real paper.

Trace the cohort and risk sets
Compare the methods and save a checked sampling note.
What makes a case-control study nested?
The cases and controls come from the same defined cohort. With risk-set sampling, controls must still be in the study and free of its outcome when the case event occurs. They stand for people who could have become that case.
V. L. Ernster's review describes why the design can save work. Testing stored blood samples or tracing past exposures for everyone can be costly. A small sample needs fewer tests, but its estimates have more chance variation.
A control can become a case later. The same person may also be drawn for more than one risk set. Those roles refer to different event times; “control” does not mean the person will stay free of the outcome forever.
The word “nested” is sometimes used more loosely. Vandenbroucke and Pearce's methods review distinguishes risk-set sampling from controls chosen at the end of follow-up. Check the actual rule rather than relying on the title.
Read the cohort and event-time rules
Start with the group that could supply a case. Find the entry rules, what counts as an outcome and when follow-up starts and ends. Then ask who could be drawn as a control at each event time.
Identify the underlying time scale
A risk set is the group still at risk just before a case event. Its members must have entered the study, remain in follow-up and meet the outcome rule. Someone who has already left the study cannot be drawn at that time.
The clock might track age, time since entry or calendar time. The Karolinska lecture shows how changing the baseline changes who appears in a risk set.
Write that scale in the note before listing the matching factors. “Same time” is unclear when one reader means the same age and another means the same date. Check what the paper's clock measures.
Separate eligibility from additional matching
First find the event-time risk set. Then check for further rules, such as matching on sex or birth interval. Record how controls were drawn from that group and how many were chosen.
In Rentroia-Pacheco and colleagues' original Figure 1, panel A shows unmatched sampling and panel B adds sex matching. Red events mark cases; crosses mark the end of observation. Circles mark sampled controls, drawn from the event-time risk sets.
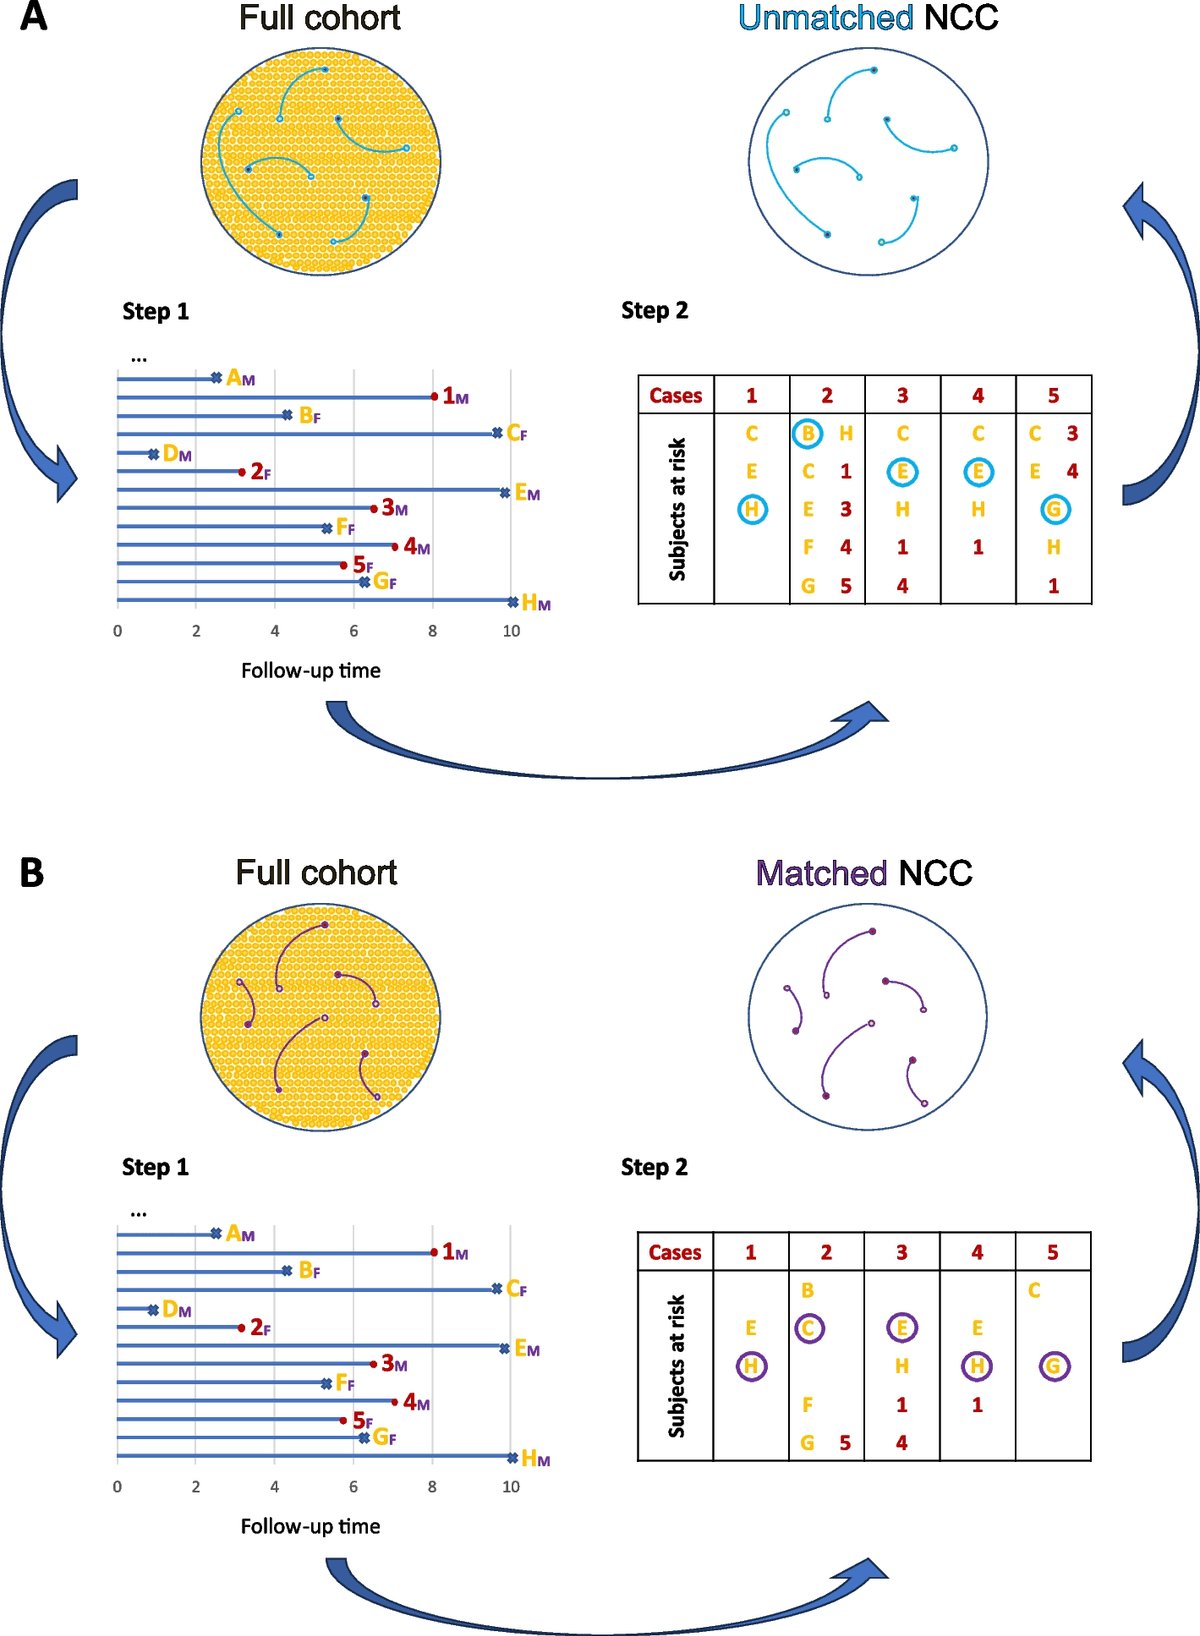
The full source diagram includes a later case in an earlier risk set's pool of controls. Sex matching narrows that pool in panel B. This is a teaching diagram. The paper uses other matching factors in its Rotterdam case. Rentroia-Pacheco and colleagues published the figure under CC BY 4.0; it is reproduced unchanged.
When taking notes, keep “eligible controls” and “selected controls” in separate fields. The few circled people are not the whole pool. Keep the risk set and its sample distinct.
Trace the uranium-miner example through its methods
Langholz and Richardson's 2009 paper uses the Colorado Plateau uranium miners cohort to explain sampling. The authors already had radon estimates. They ask readers to imagine needing to collect those data from work records.
This is the authors' worked methods example. Read the cohort account and Figure 1 caption before looking at its sampled sets. Four rows keep the source's linked choices together.
Use this note to trace the authors' rules back to the methods. It does not rebuild the miners' records or yield a new effect estimate.
| Design choice | Published example | What to retain in the note |
|---|---|---|
| Cohort and outcome | Uranium miners under observation; lung cancer death is the event | Outcome is death, not a diagnosis date |
| Risk-set clock | Controls are alive and on study at the case's death age | The shared scale is age, not one calendar date |
| Further matching and sampling | Figure 1C samples two controls from five-year birth-interval matched sets | Matching restricts the pool before sampling |
| Exposure cutoff | Histories stop two years before the risk-set age | Preserve this study-specific cutoff for cases and controls |
Table 1: The note preserves the study group, clock, matched pool and exposure window.
Miners reached the same age in different calendar years. The birth-interval rule deals with part of that difference. Do not replace it in your note with “matched on year of death.”
The exposure cutoff reflects the use of death as the outcome rather than diagnosis. The two-year rule belongs to this example. Keep its reason with the cutoff when you compare it with other papers.
A useful document comparison separates those fields across studies. If another paper uses time since enrollment, flag the difference before treating its risk sets as equivalent to these age-based sets.
Keep sampling and analysis choices separate
The note should explain how the data arose and name the reported analysis. A short methods note cannot judge or reproduce the whole model.
Read the estimator in its design context
With the right analysis, risk-set sampling can target a rate ratio. The Vandenbroucke and Pearce review explains why this route does not require the overall disease to be rare. End-of-follow-up sampling has a different interpretation.
An odds ratio alone does not tell you the target measure. Read the sampling route, model and assumptions together. Use the authors' stated measure; do not rename every odds ratio a risk ratio.
The KI lecture's matched-analysis explanation connects risk sets with conditional logistic regression. The analysis must account for matching. Matching alone does not deal with all confounding.
If the report is unclear, leave a precise question. Does the model use the matched sets? How does it handle changes in exposure? A missing sentence does not prove that the team skipped the step.
Distinguish prediction validation from association analysis
The 2024 Rotterdam application evaluates a prediction model. Its unmatched and two matched sampling scenarios each contain 163 cases and 163 controls from 4,377 women. Those sample counts are not a population risk.
For that model check, the authors keep one record per person and use sampling weights for the model scores. Keep those choices tied to their task. Do not treat them as a rule to delete repeated controls from every study.
The note needs the research goal as well as the sampling design. Two papers can both be nested case-control studies yet ask questions that need different analyses.
If an answer blends those tasks, use a source-checking workflow to reopen the methods passage. Correct the note before carrying its rule into your own analysis plan.
Distinguish risk sets from a subcohort
A case-cohort study draws a subcohort, usually at baseline, and uses it alongside cases. Risk-set nested sampling draws controls when case events occur. The methods review's three sampling routes also distinguish these from choosing controls who remain free of disease at the end. All three can use cohort data, but their control pools and analysis rules differ.
When reading a paper, find the sentence that tells you when controls were chosen. Does it name a baseline sample, an event-time risk set or the end of follow-up? Put that passage beside the design label. If they seem to conflict, leave the question open and check the full protocol. A flowchart with a small control group does not, by itself, tell you which sampling route was used.
Check what the sampling note supports
A general case-control study still requires a defensible source population and control-selection rule. This guide adds the cohort and event-time trace. Nesting does not remove weaknesses in the underlying cohort.
People lost to follow-up, missing blood samples and errors in exposure data can still matter. So can factors the study did not measure. Find the source passage for each issue. Risk-set sampling does not mean “no bias.”
A case-control sample contains a deliberately selected mix of cases and controls. Ernster's review abstract explains the efficiency goal; it does not turn that sample's case fraction into cohort incidence.
Keep missing details visible. If the sampling ratio, matching range or exposure cutoff is unclear, mark the field “not established from supplied methods.” Do not fill it with a common rule from another paper.
The original miner paper tests design questions under stated assumptions. Reading its example does not prove a causal radon effect or validate a different cohort. This note helps you compare sources; it does not guide clinical decisions.
Save a checked sampling note in Atlas
Use Atlas to compare supplied papers and keep the evidence note with its source set. A research synthesis workflow helps separate what each paper says before combining them.
- Add the selected paper and relevant methods guidance to one project. Wait for processing, then open chat and type @ in Ask a question to select those sources.
- Choose Project only to prevent new web or literature retrieval. Earlier chat context remains available, so name the paper and method sources you intend to compare. Ask: “Trace the cohort, outcome, time scale, risk-set eligibility, matching, sampling ratio and exposure cutoff in this paper. Cite each field. Mark unclear details.”
- Open each citation. Check the surrounding methods and figure caption. For the miner example, verify age, five-year birth intervals, two sampled controls and the two-year cutoff; keep them as source-specific rules.
- Correct any mix-up between later-case eligibility and the final analysis record. If the answer imports Rotterdam prediction-validation handling, ask it to separate the two papers' goals and passages.
- Select New, then Note. Save the checked fields, supporting sources and open questions. Wait for Saved before leaving the note.
Accept the note only when another reader can trace each rule to the right source. Atlas helps with reading, comparison and notes. It does not sample participants, fit models, calculate weights or certify the study's conclusions.
Trace the cohort and risk sets
Compare the methods and save a checked sampling note.