

Outcome evaluation checks whether a program reached its goals. It can show whether people met a target or how a result changed over time. Those findings alone do not show what caused the change.
For a reading program, a session count shows work done. Reading scores show a learning outcome. To claim that the program caused higher scores, you need to judge what would have happened without it. Keep these three questions separate when you read a report.

Review outcome evidence in Atlas
Compare selected reports, open their citations, and save a checked outcome note.
What is outcome evaluation?
An outcome evaluation checks how far a program's goals were met for people, a team, or a place. The goal might be a change in skills, knowledge, habits, or access to services. The report should say whose result was checked and when.
The CDC's evaluation guide separates outcomes from causal impact. Showing that people did better supports a different claim from showing that the program made them do better.
Results can guide choices even when the cause is unclear. A team may need to know whether people met a target or retained a skill six months later.
Outcomes, delivery, and causal impact
Think of a program with weekly reading sessions. A process evaluation asks whether the sessions took place, who came, and whether staff taught the planned lessons.
An outcome evaluation asks whether students met the reading goal. An impact evaluation asks how their results compare with what would have happened without the program.
James Bell Associates explains how process findings can help teams make sense of outcomes. They help you ask why a goal was or was not met.
Running 20 sessions may meet a plan to offer lessons, but it does not show how much students learned.
Low scores do not tell you whether staff followed the plan either. TSNE's guide explains why teams should check the work and resources behind the results.
Fields and older guides do not always use these terms the same way. Here, "outcome" means whether the goal was met, and "impact" means the question about cause. Read the methods before you decide what a report's label lets you claim.
Define the outcome before reviewing findings
Write the goal as a clear statement about a group and time period. For example, students in the program should show a stated reading skill by the end of term.
Choose a measure that fits, such as a named reading test with a rule for passing. A survey about whether students liked lessons does not show a reading gain. If the report uses it that way, note the mismatch and ask for a fitting measure.
Operationalization explains how a broad goal becomes a rule you can test. Keep the test's purpose, scoring rule, and target beside each result.
The CDC diagram links the purpose, questions, and setting to the study design and methods. People with a stake in the program help inform those choices. A question about reading skill and a question about the program's effect may need different designs.
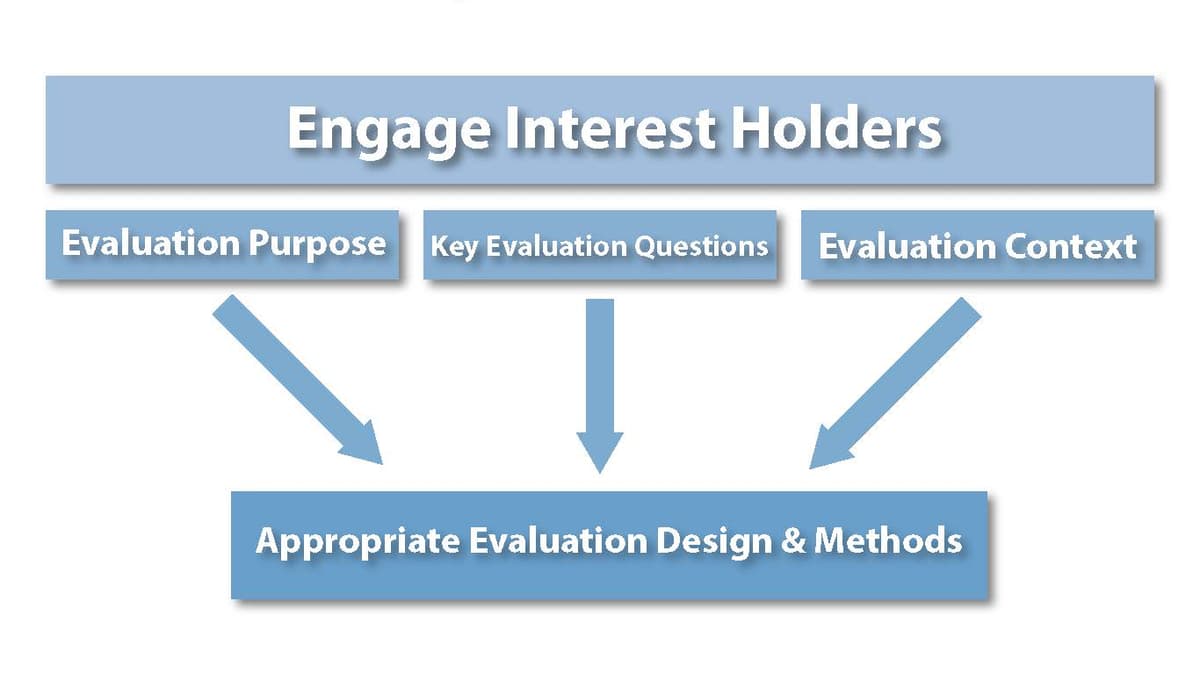
Design choices follow the question and setting. Materials developed by CDC are available free on its website. Reuse does not imply endorsement of Atlas by CDC, HHS, or the United States Government.
The time of each check matters too. A test at term end and a test six months later answer different questions. Later scores help you check how much learning was retained.
Metis Associates advises teams to plan a baseline, choose fitting measures, and think about results over time. A baseline is the starting value used to judge later change.
Ask students and staff whether the measure captures the change they care about. A well-known test may not work equally well for every group.
Check the evidence behind reported change
Before you combine findings from several reports, check whether they can be fairly compared. The OJP report-review resource offers a route to more guidance. Use these steps to find what is present and what you still need to ask.
- Find the measure's definition. Note the test, scale, target, and source page. Keep any change in wording or scoring between checks in view.
- Check who supplied data. Separate everyone who joined from those tested at the start and end. Does the report track the same people at both times?
- Note when checks took place. Did they happen before, during, or after the program? If the baseline came after services began, keep that caveat.
- Keep the group count. The denominator is the total used to work out a rate. A rate among people tested at the end may differ from a rate among everyone who joined.
- Find gaps. A recorded zero differs from a missing score. Note where the report lacks a starting value, later result, test details, or facts about a comparison group.
- Read the design and limits. Does the report show change, a link, a target met, or an effect caused by the program? Keep the author's caveats with the finding.
For one example, the EPA's outcome-evaluation guide calls for a baseline before a public communication program starts. Its measures cover knowledge, plans, and habits. The measure you choose must fit the kind of change you want to check.
If a report says 80% met a target, ask "80% of whom?" before calling it a success. If it compares mean scores at two times, check who was tested and whether the test stayed the same.
The unit of analysis matters when records describe different levels. A student's score, a class mean, and a school target are different kinds of result. Keep the level used by the report clear rather than merge them into one claim.
Worked outcome evaluation example
The following program and numbers are made up to show how to check report claims. They are not findings from a real program or an Atlas test.
Suppose you have a score memo, target report, and session log. Use one row per measure to keep timing, group counts, and gaps in view.
| Reported measure | Population and timing | Fictional source location | Supported observation | Unresolved limitation |
|---|---|---|---|---|
| Mean reading score rose from 42 to 51 | Same 30 students, entry and term end | Assessment memo, results table | Mean score increased among measured students | No estimate of change without tutoring |
| 80% reached the reading threshold | 40 end-of-term respondents | Attainment report, findings | Most respondents met the stated endpoint | Starting attainment and matched records absent |
| 20 sessions delivered | Program activity during the term | Attendance register, session log | Planned activity occurred | Does not measure reading improvement |
| Six-month reading score | Follow-up planned in the protocol | Assessment memo, follow-up section | Later measurement was planned | Results not supplied, retention unknown |
Table 1: The first row shows a change in the same group over time. The second shows who met a target at term end. It cannot show how many students did better than their own starting score.
The third shows work done, while the fourth shows a planned check with no supplied result. The files do not yet tell you how students did six months later.
For the target row, ask how many met it at the start, how many joined, and who was tested at the end. For retained learning, ask whether the later check took place and where to find its results.
Match the conclusion to the design
A before-and-after score can help describe change. It leaves open other causes, such as events outside the program. The people tested at the end may also differ from those who left. A claim about cause needs a design that deals with such alternatives.
The CDC design guide links the design to the purpose, questions, setting, and resources.
If a funder needs to know the program's effect, plan a study that can answer that question. Stronger words in the final report cannot make a weak design answer it.
For the fictional score row, revise this claim:
Tutoring raised students' reading scores by nine points.
To this bounded observation:
Among the same 30 students tested at entry and term end, the mean reading score rose from 42 to 51. The report does not estimate how scores would have changed without tutoring.
A report with a comparison group still needs a close methods review. Check how groups were formed, whether tests and dates align, and how the study team dealt with group differences.
Keep the question of where the result applies separate too. Scores among students tested at one site may not describe all students or other places. External validity explains that wider question. A gain alone does not show who else would gain.
Review selected outcome reports in Atlas
Use Atlas to compare the reports and save a checked note. Add only files you have permission to upload. Follow your team's rules for handling data about people.
- Add the score memo, target report, and session log to one project. Wait until processing finishes, then open a chat.
- In Ask a question, type @ and select the sources you need. Choose Project only to bound new retrieval to the project without a web or literature search. Earlier chat context remains available, so name the report set you intend to compare.
- Ask a focused question that keeps findings, group counts, and gaps visible. The prompt below shows one way to do this.
- Open each key claim's numbered citation and read the source passage and caveats. Fix any row that adds facts the source does not give.
- Select New, then Note. Save the checked table with source references and open questions. Wait for Saved before closing the note.
For the example reports, use this prompt:
Compare the outcome findings in these selected reports. Use one row per measure. Include who was tested, start and end dates, group counts, results, and source citations. Keep counts of work done separate from results for people. Flag gaps. Quote claims about cause apart from the facts used to support them.
For the target row, check who was tested and whether a starting value is given. If the answer adds a value the source does not give, remove it. Ask for a revised row that keeps each report's facts and gaps distinct.
Keep "baseline not reported" distinct from "no baseline was collected." The first says what you found in the files. The second says what the study team did. Ask the team to clarify when that difference affects the claim.
The study team still owns the checks on measures, analysis, and claims about cause. A cited table does not prove that a study is sound.
Report findings with their unresolved questions
State the result, group, timing, and caveat together. In this example, the team can report a gain among the same students tested twice. It should also say that the later results and the program's causal effect remain unknown.
Name what you need next. It might be the later report, test details, a group count, or a design review. If the gap changes the choice the team must make, revisit the evaluation question before you gather more data.
Keep the checked table beside the written finding. When a new report arrives, update the row and claim together. That helps stop an old success claim from staying in use after its supporting facts change.
Review outcome evidence in Atlas
Compare selected reports, open their citations, and save a checked outcome note.