

A prospective cohort study tracks a group forward in time to compare later events across groups with distinct exposures. To make “forward” clear, specify when exposure is assessed, when follow-up starts, and how the team finds each outcome.
Use those choices to read a methods section or write a design note. Two published cohorts below show why a missed questionnaire and a missing outcome deserve separate checks.

Map your cohort timeline and measures
Compare cohort methods and study notes with supporting source passages.
What makes a cohort study prospective
A cohort is a group tracked over time. An exposure is a trait or experience used to compare groups. It could be a work setting or a cycling habit. The NCI definition describes groups that differ in a trait. Researchers track what happens to them over time.
In an observational cohort, the team records exposure without assigning it as a treatment. The CDC study guide explains this distinction from a trial.
For a study of new cases, define who is free of that specific outcome at entry. A cohort can also track change in an existing illness. So “everyone must be healthy” is too broad a rule.
A retrospective cohort uses past records for a defined group. The team looks back at exposure and later events. A case-control study starts with cases and a selected control group. The team then checks past exposure. Each design selects people in a distinct way. Read the CDC’s design examples alongside the paper’s dates for entry and data collection.
Write the timeline before the label
The term “prospective” is shorthand for a design whose actual timeline still needs explanation. Because prospective and retrospective labels can be unclear, the STROBE explanation paper asks authors to describe how and when data were collected.
A later study of the same cohort may use planned tests and past records.
Separate entry from exposure measurement
Start with the question in plain language: “Among which people, does which recorded exposure relate to which later outcome?” Find the entry rules and the point when follow-up starts for each person. That starting point is often called time zero.
To study first diagnosis after entry, define how you will identify prior cases. To study symptom change, record a symptom score at the start. Both questions can track people forward, but they need different entry checks.
Record exposure timing beside entry timing, distinguishing a survey at entry from a work history taken later or a repeat test. Their dates and sources help you judge which period each measure describes.
Keep the collection dates visible
The STROBE cohort checklist, item 5, asks for dates for entry, exposure, follow-up, and data collection. Use that as a reading aid:
- Recruitment: When did people join?
- Exposure: When was the trait assessed? Could it change?
- Follow-up: When did observation begin and end for each person?
- Outcome collection: Did events come from surveys, records, tests, or more than one source?
- Analysis: When did the team use the data to answer this question?
Leave an unknown date marked “not reported in the checked passage.” Do not guess a date from the year the paper came out. When papers disagree, compare the documents at the methods passage that creates the difference.
Specify exposure, outcomes, and follow-up
A design note should let a reader see where each measure came from. “We will track health” does not name an outcome. “We will survey participants” does not explain what happens between surveys.
Define each measure separately
The STROBE checklist, items 7 and 8, asks authors to define what they track and how they measure it. In your note, pair each measure with its source.
For exposure, name the question, record, or test used and the time span it covers. Include the dates of any repeat checks so readers can see which changes the study could detect.
For an outcome, state what counts as an event or change, how it is found, and who checks it. Compare the methods used across groups to see whether each outcome was assessed in the same way.
Look for confounders, too. These are factors linked to both exposure and outcome. They could help explain a link between the two.
The factors used in the model show what the authors checked. That list does not prove that each factor was measured well. Nor does it show that all sources of bias are gone.
Plan for several kinds of missing information
Keep these questions separate: Did the person miss an interview? Is one answer blank? Can the team still access linked records? Did follow-up end because the person moved, withdrew, or died? Each event can affect a measure in its own way.
The STROBE cohort checklist, items 12–14, covers missing data, loss to follow-up, and the flow of people through the study. Use it to find gaps in a report. It does not choose how to analyze your data.
Write down what the team can still see after a missed contact. A repeat survey might be the only way to track a changed exposure. A consented record link could still capture a later event.
Note consent, record dates, and limits on matching people to records. Check a summary’s claims with an AI source checker workflow before turning them into a protocol decision.
Compare 2 published cohort examples
The Taupo Bicycle Study methods describe cycling surveys and linked records of crash injuries. The NorStOP report describes postal surveys of older adults. These cover joint pain and health, with consent to review medical records.
Compare the method that supplies the data
| Design detail | Taupo Bicycle Study | NorStOP |
|---|---|---|
| Entry and exposure | Event cyclists; baseline cycling and personal characteristics | Older adults invited through general practices; baseline pain and health measures |
| Repeat contact | A follow-up questionnaire in December 2009 | Questionnaires at 3 and 6 years |
| Outcome sources | Linked administrative crash-injury records | Questionnaire measures and consented medical-record review |
| Missed response | Repeat answers may be absent while linked injury outcomes remain available | Later survey participation is a separate check from record-review consent |
Table 1: Locate these details in the Taupo methods and linkage description and NorStOP methods. Use these details to guide your reading. A schedule that fits one cohort may not fit yours.
Read a flow diagram with its denominator
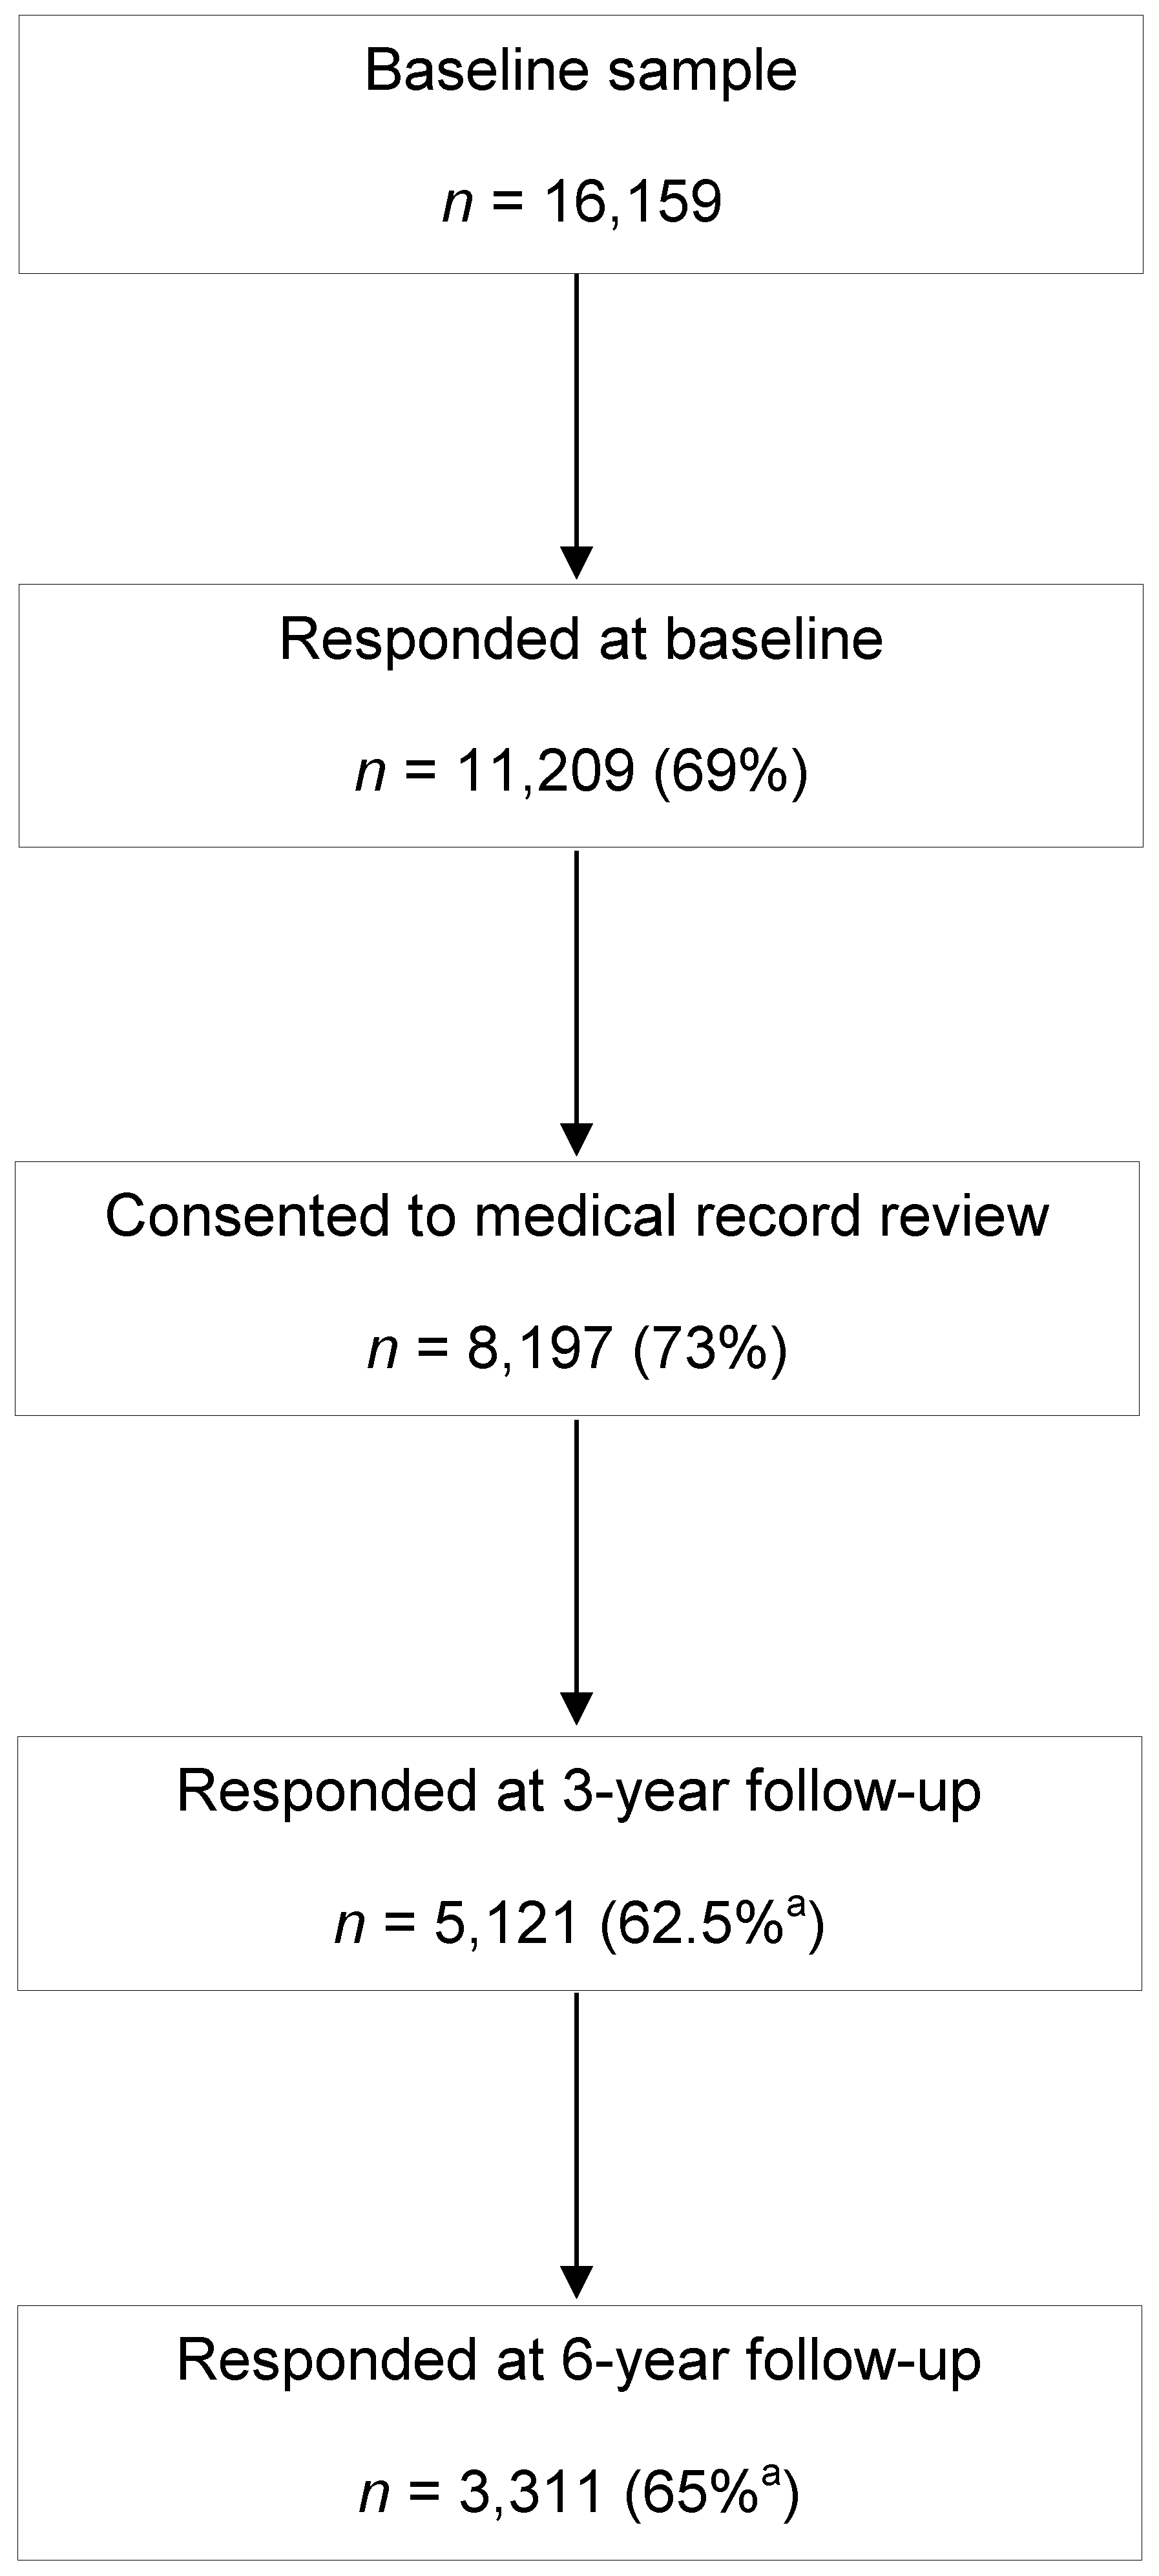
Original Figure 1 from Lacey, Jordan, and Croft (2013), reproduced unchanged under the publisher-linked CC BY 4.0 license.
The diagram starts with 16,159 invitations, then shows 11,209 baseline respondents, 8,197 consenting to record review, 5,121 respondents at 3 years, and 3,311 at 6 years.
The group used to work out each percentage changes, and the footnote says response percentages are unadjusted for people who moved or died. These counts describe participant flow without establishing whether or how much an estimate is biased.
In your note, keep each stage’s name and base count. People who miss the last survey may be absent for several reasons. Do not merge them into one kind of loss.
Use the diagram alongside the study’s eligibility and follow-up methods, then ask which measures remain available at each stage.
Check bias before interpreting an association
Tracking exposure before a later outcome helps establish time order, but a causal claim needs further checks. Groups may differ in other ways, measures may contain errors, and people who join or stay may differ from those who do not.
The CDC discussion of study design and interpretation is a starting point for those checks.
Read the methods to compare who could join with who did join, check whether groups used the same measures, and identify the factors the team considered. The STROBE checklist, items 9 and 12, points to steps taken to address bias and the methods used to analyze data.
A response count does not show which way bias goes or how large it is. You need to know who is missing and why. You also need to know how the missing data relate to the question.
The Taupo paper shows why missed surveys and linked outcomes need separate checks. Record links do not solve every missing-data problem.
Keep claims within the evidence you checked. “Exposure preceded the recorded event” is narrower than “exposure caused the event.” “The report describes record linkage” is narrower than “all outcomes were captured.” The stronger claim needs checks of record coverage, study design, and the methods used to analyze data.
Save a checked design note in Atlas
Use Atlas to collect papers you may use, compare their methods, and save a checked note. Share the note with your research team. Atlas does not recruit or track people, test power, analyze outcomes, or approve a protocol. Use the right people and tools for those tasks.
- Add the method papers and checked notes to one Atlas project. Wait for the sources to finish processing.
- Mention the relevant sources with
@in chat. Ask for passages on entry, exposure, follow-up, and outcomes. Request citations and mark unknowns. - Open each citation and check its context. Check dates, measure names, consent limits, and base counts in the report.
- Select New, then Note, and save the checked findings with open questions beside the facts. Wait for Saved before closing so your team can return to the design choices still unresolved. Use the same source checks when you synthesize research papers.
Try this prompt: “Compare these cohort methods. For each source, find who could join, the entry date, when exposure was checked, what each outcome means, its data source, follow-up dates, and how missing data were handled. Cite the passages. Separate missed questionnaires from missing outcomes. Mark what is not reported. Do not choose a method to analyze data or claim cause and effect.”
Map your cohort timeline and measures
Compare cohort methods and study notes with supporting source passages.