

A case cohort study uses a random sample from a cohort, called the subcohort, alongside cases found during follow-up. Some people in the subcohort can become cases. Keep those two kinds of membership separate when you read the methods and sample counts.
The aim here is to build a checked selection note from a report. You will trace who entered the cohort, how the subcohort was sampled, and which cases were added. That note helps you inspect a finding without pretending that a clear sample diagram proves a valid analysis.
The worked example traces sample counts in a published teaching presentation. Use its cross-tabulation to check how case status and subcohort membership overlap.

Trace the sample back to the methods
Compare supplied reports and retain a checked selection note.
What the case-cohort sample contains
In the usual case-cohort design, researchers select a random subcohort without regard to later outcome status and include cases from the cohort. Sharp and colleagues describe this structure. The smaller sample can reduce the work needed for costly measurements.
The subcohort is not simply a group of people who stay free of the outcome. Its members come from the cohort's sampling frame. A member who later becomes a case still belongs to the sampled subcohort. The Karolinska teaching notes illustrate that overlap.
Read “case” as outcome status and “in the subcohort” as sampled membership. They answer different questions. A table that crosses the two fields can be easier to interpret than a single total or the loose label “controls.”
Different versions of the design need different details. Start with the authors' sampling account and methods references. A label in the title cannot tell you which people entered the analysis or how their observations were used.
Keep three sampling designs distinct
Several designs can use a cohort as their source population. The important distinction is how the smaller measurement sample is chosen. Read the selection procedure before applying a familiar design name to the paper.
Full cohort measurement
A full cohort study may use tests from all the people who meet its rules. A case-cohort study uses some costly tests on a smaller group. The larger cohort still supplies the people at risk. Johansson explains both reasons for subsampling: costly data collection and more manageable analysis datasets.
Keep the whole cohort apart from the group tested in your notes.
“The cohort contains many people” does not mean each person had each test. Find which records, stored samples, or test results the authors could use for each group.
Random subcohort plus cases
The usual case-cohort approach draws a random sample from the people in the cohort at the start. It also includes cases.
Who could be drawn into that sample is one question. When the team drew it or tested stored blood is another. Keep both dates and their roles clear in your notes.
Sharp's introduction distinguishes sampling and measurement timing. Do not assume that a later lab test means the team chose its sample based on who had the outcome. Look for the actual rule and the group to which it was applied.
Controls selected at each case time
Standard nested case-control sampling chooses controls from the risk set when a case occurs. The risk set contains people still eligible and at risk then.
The Karolinska comparison contrasts that rule with drawing a random subcohort.
For broader case and control selection, the case-control study guide shows why source population, dates, and selection routes matter. Use that background while retaining the specific sampling rule reported in the case-cohort paper you are reading.
Trace selection before reading the estimate
Start by finding who could enter the cohort. Read the entry criteria and how long the team tracked the outcome. Then find how they decided who was a case. A disease name alone does not tell you how cases were found or checked.
Next, find how the subcohort was drawn. Record any strata, the share sampled, and who was left out. A stratum is a subgroup used in sampling, such as a study center. If the team sampled within each stratum, keep that rule in the note.
Sharp's reporting recommendations ask for cohort, subcohort, and case counts before and after exclusions. Give each number its group and stage. A number after missing-data exclusions cannot replace the original selected count without explanation.
Keep a source location beside each entry. If the main paper refers to a cohort protocol or supplement, inspect it before filling the cell. Write “not found in the reviewed sources” when a rule remains unreported. That wording describes the review you actually completed.
The official STROBE checklists provide core observational reporting fields. The STROBE checklist guide shows how to map a field to manuscript text. Use the relevant case-cohort methods guidance alongside that reporting check.
End by finding the named analysis method and its reference. Save what the authors report about sampling, weights, and uncertainty. This is a source-reading record, not approval of the estimator. An analyst must judge whether the method fits this particular design.
Worked case and subcohort selection note
Anna Johansson's 2016 presentation uses Swedish women born in 1948–1952 in a teaching comparison. Slide 19 describes breast cancer events at ages 25–50, a random 5% subcohort, and inclusion of cases outside it.
The note below traces membership using slide 20's cross-tabulation and slide 21's follow-up setup. It reorganizes reported information for reading; it does not reproduce the model or draw a clinical conclusion about education and breast cancer.
| Selection field | Reported source detail | What to retain in the note |
|---|---|---|
| Eligible cohort | Slides 19–21 describe the cohort and show 323,850 people remaining in the follow-up setup | Keep the cohort eligibility and time rules beside its count |
| Random subcohort | Slide 20 reports 16,219 selected members: 15,990 non-cases and 229 cases | Preserve sampled membership even for members who became cases |
| Cases added outside it | Slide 20 reports 4,692 cases outside the subcohort | Add these people to the measurement sample without adding the 229 inside cases again |
Table 1: The table makes a membership distinction visible. Its case and subcohort figures come from the presentation's sample table, not new data collected for this article. The source itself reports a case-cohort sample of 20,911.
Correct the overlap claim
Suppose a draft note says: “The random subcohort excludes everyone who became a case, so every case was added later.” Slide 20 contradicts that statement. Its case row includes people both inside and outside the subcohort.
Replace the draft with: “The subcohort contains 229 cases. A further 4,692 cases fall outside it.” Keep the source location beside the correction. This wording retains both fields rather than changing the meaning of subcohort membership to fit the original sentence.
Do not label the correction a finding about disease risk. It repairs how your note describes the sample. The presentation's model results answer a different question and need their own methods and interpretation review.
Keep the follow-up setup attached
Slide 21 shows age-based entry and exit settings. That matters when you describe which events count. A paper's birth years, calendar dates, age window, and analysis time scale are related details; they are not interchangeable date labels.
If your note only says “a cohort of women,” it loses the scope of the example. Retain the named source, cohort description, and time rules. Check the original study references before borrowing this teaching example for a new research proposal.
Separate a reading check from statistical approval
A clear selection note helps a reader ask better questions. It does not show that the sample was large enough, missing data were handled well, or the effect estimate is unbiased. Keep those judgments open until someone reviews the relevant evidence.
Sampling changes the analysis
The model must account for the way people entered the sample. The Karolinska notes show several approaches, including ways to use the subcohort and cases. The analyst must choose which fits the study. One example's weights or software settings cannot serve as a recipe for every design.
The same subcohort can support more than one outcome, as Johansson's presentation explains. Each outcome still needs its own case rules and a model that fits. Sharing the sample does not let you copy the time rules or claims from one outcome to the next without checking them.
Missing reporting is an open question
If a paper does not name its method, mark that gap and seek the supplement or cited methods source. Sharp and colleagues distinguish reporting gaps from analysis errors. You cannot infer that the authors used an unsuitable method solely because the short report lacks enough detail to judge.
Use your literature review process to find linked protocols, fuller reports, or corrections. Record which version you read. A later report may resolve a question, but it should not quietly replace the earlier source in your notes.
Test what the note lets you claim
Try a small reading check before you move on. Write the claim you want to cite next to the source that could support it. If the claim is about who was tested, a sample table may help. If it is about why an outcome arose, the same table cannot settle that question.
For example, the worked note tells you that cases can be inside the random subcohort. It does not tell you why any one person became a case. Do not let the word “random” change from a rule for drawing the sample into a claim about assigning an exposure.
Now check whether your draft stays within what you read. A claim about all adults would reach beyond a source about a stated group of women and a stated age window. Keep that wider claim open and find evidence for it. Clear source labels help you see the gap.
The STROBE reporting forms can guide where to look for study details. Tick a field only after you find the relevant text. Your note should say what that text shows, which question it answers, and what you still need to check.
Check supplied study passages in Atlas
Bring the study report, relevant supplement, and methods guidance into the same Atlas project. Wait until the sources have finished processing. Choose the specific sources for a focused question and retain the original files for your own review.
-
Open a chat and type @ to select the report and the methods source you want to compare. Name the study or teaching example clearly so a later follow-up stays tied to it.
-
Ask: “Find the passages that define the eligible cohort, random subcohort, cases within it, and cases outside it. Give a source location for each. Mark rules you cannot find.”
-
Open each citation and inspect the source text. Read nearby paragraphs, captions, and table labels. Use direct page or passage navigation when available; otherwise find the named location in the source yourself.
-
Check an answer that calls every case an extra sampled person. Ask for the cross-tabulation of case status and subcohort membership, then correct the overlap statement in your note.
-
Compare any sample totals with their labels and exclusion stage. Keep the original selected sample apart from the final analysis sample. Leave an unresolved count open instead of guessing its cause.
-
Select New, then Note. Save the checked selection fields, source locations, correction, and unresolved questions. Wait for Saved before closing the note.
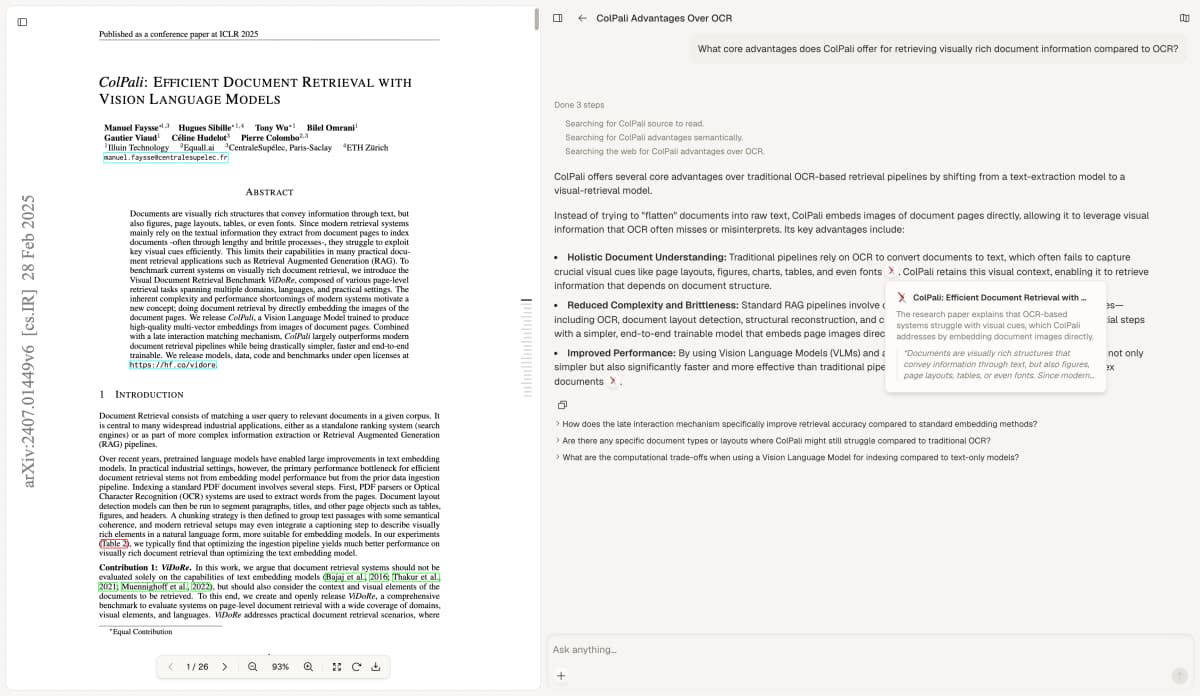
This Atlas capture shows ColPali, by Manuel Faysse and colleagues, under CC0. The unrelated paper illustrates source inspection, not a case-cohort analysis, checked participant record, or evaluation of this reading workflow. Atlas captured the interface without editing the displayed paper.
Keep the note useful for another reader. Attach the source title and version to each locator, rather than relying on a remembered page number. Organizing research notes around sources makes later corrections easier to trace.
Retain the sampling reason with the claim
Before using a finding in your own writing, revisit the selection note and the exact results passage. State which population, outcome, and follow-up period the finding concerns. A design label alone gives the reader too little context.
Carry unresolved questions to an epidemiologist or analyst. Ask which source would establish the missing rule and whether it affects the claim you intend to use. The reported sampling account is a starting point for that discussion, not proof of validity.
For a proposed study, experts must review the design, size, tests, consent, model, and claims. The Karolinska methods notes provide background for that discussion. A source note cannot approve those choices or prove a cause from an observed link.
Atlas supports reading supplied material and saving checked notes. Keep method choice, statistical work, and final conclusions with the research team. Return to the note when a new report or reviewer question changes what you need to verify.
Trace the sample back to the methods
Compare supplied reports and retain a checked selection note.