

Explanatory sequential mixed methods starts with a quantitative phase: collect numerical data and analyze it. Then use the findings to shape a qualitative phase, such as interviews.
Choose questions that address a result you need to understand, and bring both sets of findings into the final account.
A survey may show that students use a service less often than expected. It cannot, by itself, tell you what happened when they tried to use it. Use that gap to plan who to speak with and what to ask.
Fetters, Curry and Creswell describe this sequence in their guide to bringing mixed methods findings together.
Keep the finding, its limits and the proposed question together. That gives a reviewer something to inspect before fieldwork starts and a place to return when the interview findings arrive.

Connect a finding to its follow-up question
Compare your result, survey wording and plan with the cited source passages.
Understand what makes the design explanatory
Finish the first phase, including the analysis, before choosing what to explore next. You can then see which results need more depth and plan interviews or other forms of inquiry around them. At the end, ask what you learned by reading both sets of findings together. Interviews on a new, unrelated topic would not explain the survey result.
The order helps you choose between designs. Exploratory sequential work begins with accounts or observations that inform a later phase using numbers. In a convergent mixed methods design, both strands usually develop over a similar period before you compare their findings. Choose the order that fits your question. The fact that you have two kinds of data does not settle the choice.
Decide what you need to learn beyond the number. A surprising result or a pattern within one group may need more depth. You may also want to explore an experience that a survey item missed. The NIH mixed methods guidance asks you to explain how one set of data builds on the other and how you will read them together.
State the role of each phase as well. One study may place more weight on the first phase. Another may need detailed interviews to answer its main question. The Ivankova, Creswell and Stick methods paper discusses these choices about weight, order and the link between phases. Explain your choices rather than leaving them to the design label.
Select a finding that needs follow-up
Choose a result from the completed analysis and keep its source beside it. What did you measure? Who gave the data, and which period did the question cover?
If you compare groups, explain who belongs in each one. A percentage without the count or survey wording gives you too little to work from.
Suppose a fictional campus report says that 24 of 60 people used a study room in the past month. The survey reached students through a mailing list, and they chose whether to reply.
You can state what those people reported. You cannot use that count to say how often all students used the room.
A useful next question asks what happened when people thought about using the room. A claim that its hours caused low use goes beyond the count. There may be several reasons to use another space. Leave room in the interview plan for people to describe those reasons in their own words.
The practitioner guide to explanatory design discusses how surprising findings and differences between groups can guide the next phase. State which feature of your result needs more depth before drafting questions about it.
Check that you can read the result in the first place. If a count is missing, an item is unclear or a code is wrong, the team may need to correct the first phase.
Interviews can explore how people understood an item. They cannot turn a faulty number into a sound one. Record the defect and decide what it means for the next phase.
Connect findings to questions and participants
Once you know which finding to explore, choose people who can speak about the relevant experience. Explain why their accounts would help. Speaking only to those easiest to reach may miss the people behind the pattern that drew your attention.
The methods article on integration through connecting examines how first-phase data can guide the choice of cases to interview. It includes cases that fit an expected pattern and cases that do not. Use that distinction to choose cases that serve your question; the paper's sample sizes are examples rather than a rule for every project.
For the fictional room survey, you might seek people who used the room and those who thought about it but did not enter. They can speak about different parts of the finding. Someone who did not use it may have preferred another place or had no need for the room, so do not assume they had trouble getting in.
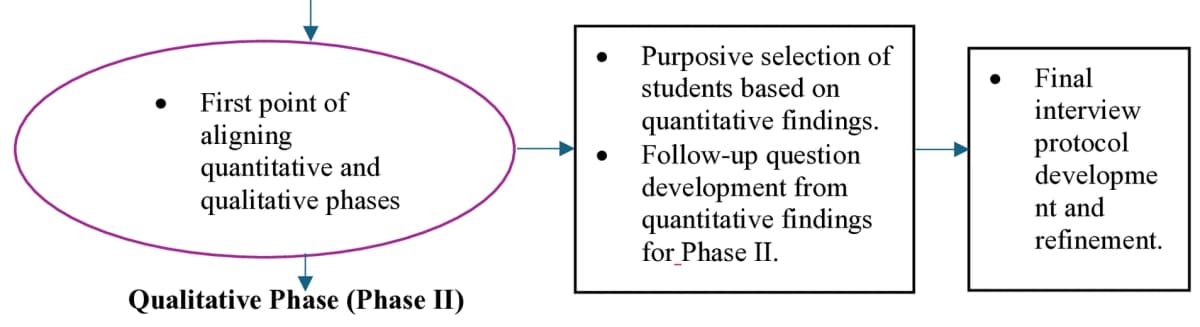
Detail from Figure 1 in Abudu-Birresborn and colleagues' study, © 2025 the authors, CC BY 4.0. Cropped to the connection between phases and converted to WebP.
The diagram shows how first-phase findings shape the choice of people and questions for the interviews. Those choices feed the plan for the second phase. This is the source study's procedure, which may differ from yours; the full figure also shows how the team brought the findings together later, outside this crop.
Write open questions that invite an account before suggesting an explanation. Ask, "Tell me about the last time you considered using the room." Follow with prompts about what happened, what mattered and what alternatives the person considered. By contrast, "How did unsuitable hours prevent you from using it?" assumes both a problem and its effect.
Check that the study permits you to contact people again. Linking a survey reply to an interview can identify someone, even if the final report omits their name. The team needs an approved way to make and store that link, with consent and data rules in the plan before you ask people to take part.
Build a finding-to-follow-up-question note
This fictional exercise uses a campus report, its survey appendix and a draft interview plan. All counts, page numbers and proposed questions below are invented teaching material. There are no completed interviews or actual study findings behind the example.
The report's Table 2 on page 4 gives the 24-of-60 use count. Table 3 on page 5 lists 9 of 20 commuters and 15 of 40 other respondents as users. Appendix A on page 8 contains the mailing-list recruitment description and the previous-month question. The draft plan's page 2 proposes asking non-users about opening hours.
| Reported finding and location | What it leaves unresolved | Proposed follow-up | Why this connection helps |
|---|---|---|---|
| Room use: 24 of 60 respondents; report Table 2, p. 4 | Reasons for use or non-use are absent | Ask selected users and non-users to describe a recent decision about the room | Compare accounts of the decision behind the observed count |
| Commuter use: 9 of 20; other use: 15 of 40; Table 3, p. 5 | The counts do not establish a cause or a population difference | Seek accounts from both groups about travel, schedules and alternatives | Explore possible context without treating group membership as an explanation |
| Voluntary mailing-list recruitment; Appendix A, p. 8 | People outside the list or those who ignored the survey may differ | Record this coverage limit when choosing and reporting interview cases | Keep the follow-up sample's relation to the first phase visible |
| Plan asks non-users about opening hours; draft p. 2 | The proposed question assumes an unreported reason | Replace it with an open account of considering the room, then probe hours if relevant | Let respondents introduce reasons the plan did not anticipate |
Table 1: The first two rows connect a finding to a question. The third keeps a limit that interviews will not remove. The fourth corrects a prompt that could steer people toward the team's preferred reason. Talking to selected cases does not make the original survey stand for all students.
Keep the reason for choosing cases beside the note. Explain whose accounts you seek, how they relate to the result and whose views you may miss. A reader should be able to trace the choice back to the first phase. For broader method choices, consult a qualitative research design guide before turning the note into a fieldwork plan.
Integrate the findings after qualitative analysis
The planning note links the phases before interviews start. Once you have analyzed the accounts, return to the first result.
A joint display is a table that puts both findings beside the claim you draw from them. State what reading them together adds. Two columns on the same topic do not explain that link on their own.
Leave the later-result fields empty until you have evidence. In this exercise, no one has given an interview. You cannot enter "hours explain non-use" as a finding. It is one possible reason to explore, and the open question lets people raise others.
If the findings disagree, ask what each one refers to. They may cover different times or groups. People may also describe something the survey did not ask about. Keep both findings and explain what the gap changes about your reading. Some questions may remain open after both phases.
An account may suggest how a process works or help you read a number in context. Whether you can claim a cause depends on the study's design and evidence.
The word "explanatory" does not prove that one factor caused another. State what you learned about the people in the study, and give grounds for any wider claim.
Check findings and follow-up plans in Atlas
Use Atlas to compare files the team has produced and approved for this use: the results, survey wording, follow-up plan and methods guidance.
Check which files the study allows you to process. Keep files that link names to responses, and any other restricted data, within the approved study arrangements.
First give each result a named source. A research paper organizer can help keep reports and method papers together. In the finding note, keep the table or page you need to check so you can return to it while reading the plan.
In an Atlas chat, type @ to mention the selected processed materials and ask:
Compare the room-use result, survey wording and follow-up plan. Give the source location and limits of the result. Suggest an open question and explain why it follows from that finding. Keep reported facts separate from possible reasons, and state what the files do not tell us.
Open each cited passage and read the text around it. Check the counts, groups and period against the report. If an answer treats the survey as proof about all students, or adds a cause that the files never reported, correct the note before using it.
Save the checked version with its source, question, reason for choosing cases and remaining limits. Create a note with New and Note, then wait for Saved.
The team still chooses the method, conducts and analyzes the study, and judges what the findings mean together. Atlas helps compare supplied files. The team must carry out the fieldwork and review whether the design fits its question.
Review the connection before reporting the study
Before fieldwork, trace questions and case choices to the first-phase findings. Check that the questions allow a surprise and that defects in the first phase remain visible.
After analysis, check those links again. Which account helps you understand which result? What do you learn from both, and what can neither phase tell you?
Keep disagreements, sample limits and open questions in the report. Show how the phases informed one another and why your view changed, if it did.
Connect a finding to its follow-up question
Compare your result, survey wording and plan with the cited source passages.