
Convergent Mixed Methods Design With a Worked Joint Display
Plan a convergent mixed methods design, merge separately analyzed findings in a joint display, and explain agreement, difference, and unresolved results.
- Byline

Summary
A convergent mixed methods design is a way to study one question through quantitative and qualitative strands, then compare their findings during interpretation.
Analyze each strand with its own appropriate method, then align comparable findings in a joint display and examine agreement, complementarity, and discordance.
The researcher owns sampling, analysis, construct matching, and integrated inferences; Atlas can help compare supplied reports and inspect source citations.
In a convergent mixed methods design, a team uses numbers and lived accounts to study one question. It often gathers both kinds of data in a similar period. Each strand gets a sound analysis before the team brings the findings together.
A survey result and an interview theme do not form an integrated finding just because they share a report.
The test is whether the team can show which findings address the same issue. Where do they agree or differ? What can the team conclude from both? A joint display makes those choices visible.
Atlas can help compare completed reports and reviewed findings. It gives citations for the researcher to open before using a pairing. It cannot decide whether two measures belong together or approve the final claim.

Atlas

Compare your study findings in Atlas
Inspect source-backed pairings before interpreting the strands together.
What a convergent mixed methods design does
The numbers strand measures a pattern, link, or outcome. The qualitative strand studies how people act, think, or explain what happened. Both address the same research question. The team plans where they will meet and often analyzes them on their own before merging results.
Fetters, Curry, and Creswell describe this common pattern. They also show that the strands can inform each other during the study. “Parallel” does not mean each task must start and end on the same day, or that the team cannot revise a step (Fetters et al.).
The merge is the point of the design. A paper with a survey section and an interview section uses two methods. Yet the reader still needs to see what each adds to the shared question.
The strands may confirm one finding, add context to each other, or conflict. The team must compare the results before it names that relationship (Guetterman et al.).
Decide whether convergent design fits the question
Choose a convergent approach when both kinds of evidence can address one question in a similar period. Neither phase should need the other's result to set its basic purpose. Ask what a number can tell you, what an account can tell you, and what becomes clearer when you read them together.
The NIH's mixed methods best-practices resource treats the merge plan as part of the study design. Plan that step before the results arrive.
When another design fits better
If survey findings must first decide whom to interview or what to ask, an explanatory sequential design may fit better. If interviews must first shape a measure to build and test, consider an exploratory sequential design (Fetters et al.).
These names describe how the phases connect. They do not rank study quality.
A convergent design needs enough skill and time for both analyses. It cannot rescue a weak survey or turn a few interviews into a population estimate. It cannot make two unrelated datasets match. The NIH best-practices resource asks teams to justify the value of mixing methods.
If the team cannot state the shared question and planned merge, it should narrow the question or revise the design before collecting more data.
Plan two strands and the integration point
Write the merge question while the design is still open. In the fictional campus study, it might be: How does stated knowledge of the contact route relate to students' accounts of getting an appointment? This names a point of comparison. It does not declare that the measures already match.
Define the result each strand can give
Plan the strands in four linked decisions. The NIH methods resource is a useful check on whether the proposal explains the reason for mixing methods and how the results will meet:
- Define each result. Record the survey item, response options, sample, and analysis plan. Record the interview prompt, recruitment approach, and qualitative analysis plan. A measure of knowing a contact name is different from a measure of receiving help.
- State the relationship between samples. Are interviewees also survey respondents, from the same eligible population, or from a different group? A person-level match is possible only when the design and consent permit it. Otherwise, compare at an appropriate group or topic level.
- Set the time window. A survey before a service change may conflict with interviews after it for a good reason. Preserve dates and intervention context with both findings.
- Specify the merge. Decide whether a joint display will align findings by construct, group, or case, and what counts as a meaningful difference. Keep room to revise a planned pairing if the actual findings show the constructs diverge.
The team should say how much weight each strand will carry. Some studies give similar priority to both. That is a choice, not a rule set by the term. Explain how that choice shapes the final claim. The integration paper gives examples of how a design choice shapes the merge.
Check the unit before the merge
One survey row may stand for a student, while one interview finding may span several students. The unit of analysis guide helps the team name those units before it aligns results.
If the units differ, a topic-level comparison may be sound even when a person-level match is not.
Analyze each strand before merging findings
Use the right method for each dataset before asking what the results mean together. For the numbers, keep the denominator, missing data, subgroup choices, and any planned tests.
For the accounts, keep the trail from a source passage to a reviewed finding. Include cases that limit it. Neither team should quietly change its result just to make the strands agree. The qualitative data analysis guide covers that earlier stage.
Check how the team turned a broad idea into a survey item. That choice matters before pairing the item with a theme from interviews.
Separate analysis lets each form of evidence meet its own standards. It is not a ban on all contact between teams.
Fetters and colleagues describe studies where the strands inform each other. They also describe a simpler parallel pattern where results are merged later. Report the pattern the team used (Fetters et al.).
Before making the display, extract each approved result with its source. The survey report should give the figure, denominator, item wording, and any uncertainty range.
The qualitative memo should give the finding, a passage, a contrary case if one matters, and a locator. If those details are missing, return to the source or analyst. Do not fill a blank with a plausible guess. The thematic analysis guide covers the earlier work of checking a theme against the source material.
Keep the reason for any changed finding. That record helps the team explain a revision after the strands meet.
Work through a joint display example
The table below is a fictional teaching example. Its campus service, survey figures, interviews, words in quotation marks, and source IDs are invented. They illustrate an integration decision; they are not evidence about students or a real intervention.
Assume a team surveyed 120 consenting students and reviewed 12 interviews during one term. Both teams approved the findings shown here before the merge meeting.
The display aligns results by access issue. Each row includes a comparison to check before drawing a conclusion. The format follows the source-backed idea of placing findings side by side, while the data remain fictional.
Compare the findings by issue
| Shared issue and quantitative result | Reviewed qualitative finding and fictional locator | Relationship | Researcher check and possible inference |
|---|---|---|---|
| Contact route: 84 of 120 respondents selected “I know whom to contact.” | I04 described knowing the desk but being redirected between two offices (fictional transcript, lines 41–48). | Complementary, if the item asks about a contact name rather than successful referral. | Check exact item wording and I04 context. Knowing a name may coexist with a confusing route; do not say 84 students completed a referral. |
| Appointment access: 38 of 120 respondents selected “I could get an appointment within a week.” | I09 described waiting 18 days after a confirmed referral (fictional transcript, lines 76–82). | Convergent on possible delay, subject to comparable periods and eligibility. | Check the survey's week definition, interview date, and whether I09 was eligible for that service. The strands may both indicate delay in this study, but not its cause or wider prevalence. |
| Digital booking: 91 of 120 respondents selected “The booking page was easy to use.” | I07 described abandoning the page after an error message (fictional transcript, lines 15–23). | Discordant at first glance. | Check whether I07 used the same page version and whether the survey item concerns ease while the interview concerns technical reliability. Keep the discrepancy open until those differences are examined. |
Table 1: The table is a joint display because each row shows how the strands meet. It asks for an inference beyond two adjacent result lists.
Guetterman, Fetters, and Creswell found convergent examples that placed themes beside statistics or set results side by side. They urge authors to name the insight gained from each pairing (Guetterman et al.).
Keep the uncertain row open
The second row supports a bounded meta-inference, or a reading drawn from both strands. Some respondents reported delays, and one interviewee described a long wait. That does not show that the referral process caused the delay or that all students shared the experience.
The third row has no settled inference. The survey and interview may concern different page versions. They may also concern different parts of usability, or they may truly conflict. Keeping that question open is more useful than dismissing I07 as an exception.
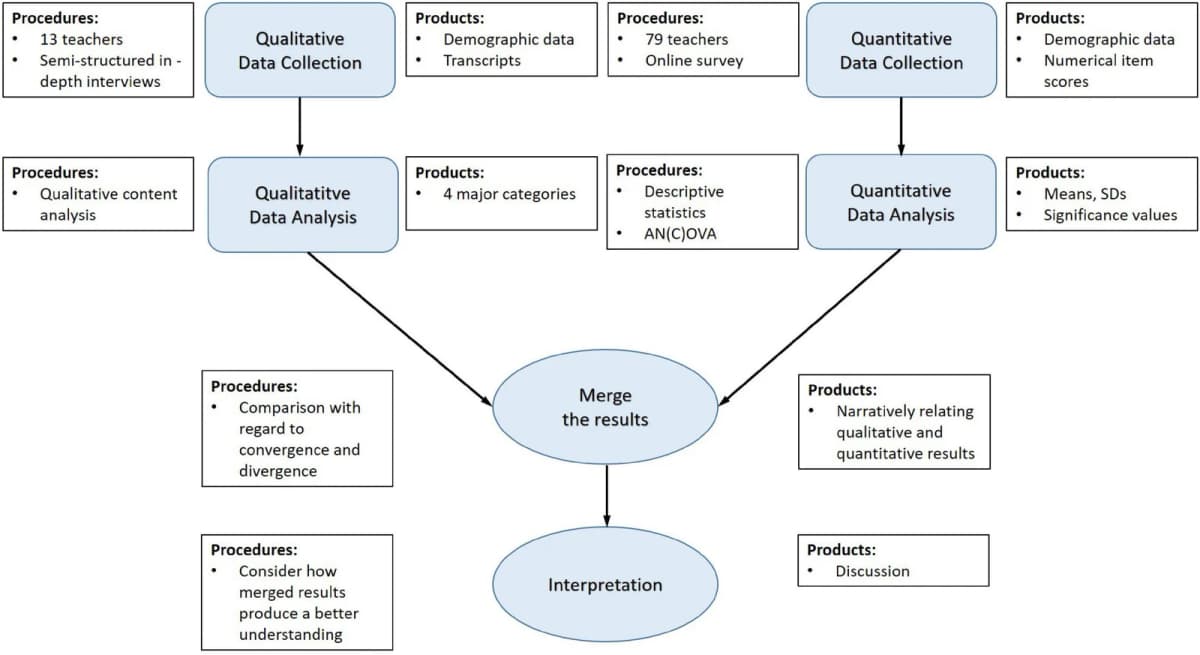
This real study design figure by Schiepe-Tiska and colleagues shows a convergent study of teachers' social and emotional learning. It places 13 teacher interviews beside a survey of 79 teachers. Each strand was analyzed before the researchers merged and interpreted the results.
The figure belongs to that published study, not to the fictional campus example above. It shows the broad merge; our table adds a row-by-row check of what the findings mean together.
Interpret agreement and disagreement
Start each pairing by asking if the findings can be compared. Check the idea being measured, the sample or case, the time window, and the unit. A percentage for all surveyed students and one person's account do not estimate the same frequency.
The account can show a process or expose a limit in the survey item. It cannot change the survey denominator. The joint-display study stresses that the display should fit the design and the kind of merge.
Name the relationship in plain terms. Agreement means the findings support a shared reading within their limits. Complementarity means they show different parts of one issue. Discordance means they seem to conflict. Fetters and colleagues call these confirmation, expansion, and discordance. They suggest checking assumptions, bias, theory, and possible new analysis when results clash (Fetters et al.).
The display is not a vote between a number and a quote. If 91 respondents found a page easy but one interviewee met an error, both can be true. Check the survey wording, the person's sample, and the page version. Ask whether “easy to use” and “worked reliably” mean the same thing.
That check is a form of comparative analysis: align the cases or findings on a shared question before interpreting a difference. Here, the comparison is part of a convergent mixed methods design, so the team must also show where each strand's result came from and how the merge changed the answer.
If they do not, change the row label or split the row. If they do and still clash, report the conflict and the next check needed. Fetters and colleagues describe further analysis or follow-up data as possible responses to discordance. One contrary account may matter even though it does not stand for the whole group.
The write-up should say what the merge added. In the fictional contact-route row, knowing a contact name may not mean getting through the referral route. The survey item alone would miss that gap. The one interview alone cannot tell the team how many students knew the contact. The claim still depends on the team's source checks.
Check source pairings in Atlas
Atlas can help handle the evidence after both analyses are done. Add the permitted survey report, reviewed qualitative findings, and merge plan to one project. Use @ in chat to select those sources. Ask a narrow question: “For the contact route, place the approved survey result beside the reviewed interview finding. Show the source and any mismatch in sample, time, or meaning. Leave unsupported links blank.”
Open each key citation. In the survey report, check the item, denominator, and dates. In the qualitative memo, check the finding and its source passage where access permits. If an answer blends sources, ask what each source adds. Reject a pairing that turns one account into a frequency claim or gives the survey item a meaning it never measured. Atlas's multi-source accuracy coverage remains partial.
After the check, save a note with the approved row, open question, and source locators. Atlas can keep that trail. The team still decides whether the strands match and what the study shows.
If you are synthesizing findings across separate papers instead, the research-paper synthesis guide addresses that different job. A convergent design integrates quantitative and qualitative strands within the study under discussion.
Report the design and integration limits
Show the route to the claim
Explain why the study needed both strands. State who was sampled, how each dataset was studied, and when the work took place. Name where the team planned to merge results and where it did so. Show how that step changed, narrowed, or complicated the answer.
The EQUATOR record for GRAMMS identifies a mixed methods reporting guide. Read the full guide and the target venue's rules before claiming compliance with any item.
Keep each limit beside the claim it affects. Different samples may block person-level comparison. A survey item may cover only part of an interview theme. One account can challenge a broad claim but cannot show how common that account is.
A display makes choices visible; it cannot repair a weak measure or missing cases. The joint-display review recommends labeling both kinds of results and naming the insight from the merge.
The result should let another reader follow the route from each strand's analyzed finding to the integrated conclusion, including any unresolved disagreement. That is the value of the display: it shows the researcher's decisions clearly enough to question them.
Atlas
Compare your study findings in Atlas
Inspect source-backed pairings before interpreting the strands together.
Frequently Asked Questions
It addresses a shared question with quantitative and qualitative strands conducted in a similar period, then brings their analyzed findings together for an integrated interpretation. The strands are often analyzed separately before they are merged.