
Comparative Analysis: Choose Dimensions and Check Evidence
Comparative analysis compares cases or source documents on shared dimensions. Build a cited matrix, mark missing evidence, and test apparent differences.
- Byline

Summary
Compare two or more cases by asking the same question of each. Then explain what the shared and different features mean.
Choose cases and columns before you fill a matrix. Keep a source for each claim. Mark gaps so readers can see what is unknown.
Check whether each case can be compared fairly. Test a contrary case and keep the conclusion within what the sources show.
Comparative analysis examines two or more cases or sources through a shared question. You use the same relevant dimensions for each case. Then you check the evidence behind each entry and explain why a pattern matters. A blank in a source leaves the answer unknown.
Suppose you have three reports on tutoring programs. You could compare how students booked help, when appointments were offered, and what follow-up each program described.
In Atlas, you can ask about those selected reports, open citations, and check each answer against its source. You still decide which programs and dimensions make a fair comparison.

Atlas

Compare selected sources in Atlas
Compare selected sources, inspect citations, and save checked findings.
What comparative analysis compares
A case is the unit you compare: a program, site, group, document, or event. A dimension is one question you ask of every case, such as its booking route or hours of access. The question gives the comparison a purpose. The dimensions make it possible to read across cases.
A side-by-side list is a useful start, but it is not yet an interpretation. You need to explain what the shared and different features show, what each source can support, and why the relationship matters.
Harvard's comparative analysis guide describes the move from listing likenesses to making a claim about the texts' relationship. For case studies, TASO's methods briefing places the question, case choice, dimensions, and rival explanations in the design itself.
This guide uses a small set of source documents. To combine studies into a literature argument, see how to synthesize research papers. To inspect changes between file versions, see AI document comparison.
How to set the question and cases
Write one question that each case could help answer. For the tutoring programs, ask how each made appointments available in its first term. That keeps the focus on access.
Choose the unit first
Decide whether each row will represent a tutoring program, a campus, a student group, or a report. A report is evidence about a program; it is not always the whole program. If one campus has two reports and another has one, decide whether to combine them or compare documents as documents.
The TASO case-study briefing ties case choice to the question. It also asks the researcher to justify the unit. Choose programs whose contrast could teach you something about access.
Check the grounds for comparison
Write down the period, setting, population, and source type for each case. Three programs serving the same kind of students in the same term may be easier to compare than programs serving different groups across five years.
Difference may be the reason you chose a case. Still, a report written before a policy change describes a different period from a later report.
The Harvard guide calls for a meaningful point of connection between sources. Record such time gaps before you compare results.
Define dimensions before reading across cases
Pick a few dimensions that answer the question. For the tutoring programs, use booking route, hours offered, follow-up, and usage measure. Define each before filling the cells, so the meaning does not drift from one program to the next.
Set one rule per column
For hours offered, record stated appointment hours in the first term. Staff office hours answer a different question. For follow-up, record a contact made after a student asked for help. A general ad belongs elsewhere.
For usage measure, copy the source's unit: visits, unique students, bookings, or another count. Do not compare the numbers until the period, denominator, and definition match. A higher count may reflect a different unit rather than more access.
The TASO briefing treats the columns as part of the study design.
Dovetail's method guide also explains why the grounds for comparison must stay clear. A matrix helps when its columns mean the same thing across rows.
Mark three distinct states
Use not reported when the source does not answer a dimension. Use explicitly absent only when the source says the feature was not provided. Use not comparable when two sources report different measures or periods. None of those marks should be silently changed to zero.
Build a cited comparison matrix
The three programs and report passages below are wholly hypothetical. The report IDs and page numbers are teaching locators we invented. In a real project, each cell would point to a passage you have opened and checked.
| Hypothetical case | Booking route | Hours offered | Follow-up after request | Usage measure |
|---|---|---|---|---|
| Program A, report A | Web form (A, p. 2) | Weekdays until 5 p.m. (A, p. 3) | Email reminder stated (A, p. 4) | Visits counted (A, p. 5); not comparable with B's unique students. |
| Program B, report B | Phone desk (B, p. 2) | Tuesday and Thursday until 8 p.m. (B, p. 3) | No reminder offered, stated in B, p. 4 | Unique students counted (B, p. 5); not comparable with A's visits. |
| Program C, report C | Walk-in desk (C, p. 2) | Not reported in C | Peer volunteer calls after a request (C, p. 4) | No count reported (C, p. 5). |
Table 1: The matrix exposes a counterexample to the quick claim that a web form made access easier: A had online booking but no stated evening hours; B used a phone desk and offered evening hours. The table does not show which program students found easier to use.
Notice three evidence states. B's report states that no reminder was offered. C's hours are not reported, so their hours remain unknown.
A's visits and B's unique-student counts are not comparable without a common measure. These labels keep the matrix from inventing a neat ranking.
An accessible method guide shows cases as rows and shared criteria as columns. Here, each cell also needs a source locator and evidence status.
A synthesis matrix guide can help organize evidence when the cases are research sources.
Test similarities, differences, and counterexamples
Read down one dimension, then read across each case. Programs A and B have stated hours and booking routes, but the routes and evening access differ. Program C cannot join the hours contrast until another source supplies its schedule.
Explain what the pattern means
A defensible finding might be: The three reports describe different ways to start a tutoring request; the available evidence does not establish which route students could use most easily. That sentence connects the rows to the question and keeps the missing outcome visible.
The tempting claim that online booking improved access fails here. B's evening hours challenge it. The table also lacks student experience data.
Ask whether appointment times, device access, or trust affected use. The matrix gives you questions to test. It cannot establish a cause.
Harvard's teaching guide urges writers to show why the relationship matters.
TASO's case-study method also calls for other explanations and cases that challenge an early pattern.
Return to the source
Read the passage around each important cell. Check whether “hours” means when students can book or when a tutor is present. Check whether B's “no reminder” statement covers the whole term. If context changes a cell, update it and record why.
The difference between a negative finding and an empty cell matters most when you write the conclusion. A report's silence is a gap in your evidence. It does not describe the program's behavior.
Next step: check the matrix in Atlas
Add the permitted reports to one Atlas project. Type @ in chat and select the three reports. State the common question and define each dimension in the prompt. Ask Atlas to keep case rows separate and cite the passage behind each claim.
Compare the selected Program A, B, and C reports for booking route, first-term appointment hours, follow-up after a request, and usage measure. For each cell, give a short answer and a source citation. Mark “not reported” if the selected report is silent. Mark a measure “not comparable” when its unit or period differs. Do not turn silence into “no,” and do not infer which program caused better access.
Open every citation and check the surrounding passage. If a cell lacks a source, leave it unresolved. If the answer merges cases or uses a different time period, correct the matrix from the original report. Save only the checked table and your open questions in a note.
Atlas supports selected-source comparison, citation opening, and notes. These steps help you inspect a small set of supplied documents. They do not establish that the cases are well chosen or that the search found every relevant passage.
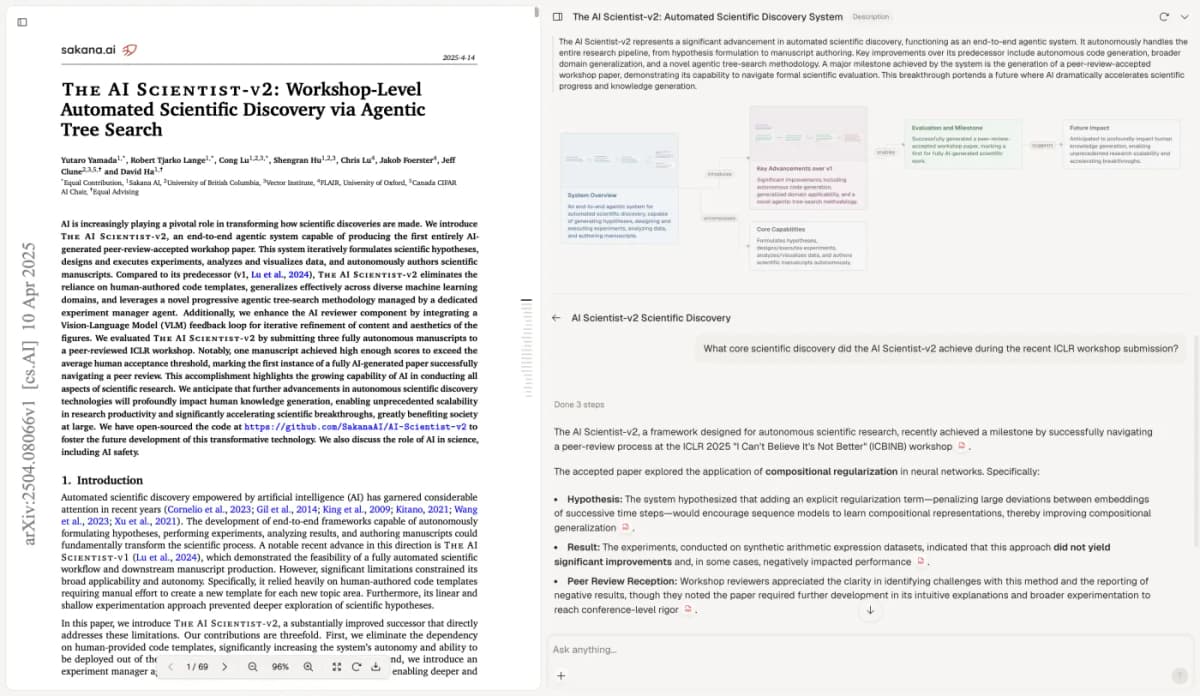
The screenshot shows an unrelated research paper beside a cited Atlas answer. It illustrates a manual source check. It does not depict the fictional tutoring reports or validate the matrix above.
Report missing evidence and limits
State the scope of your comparison: the question, cases, period, and sources used. Name any dimension you could not compare fairly. This lets a reader see whether a claim rests on direct evidence, a tentative inference, or a gap.
Do not force a complete grid
If C's hours are missing, seek an official schedule or ask the program, if your study allows it. Until then, keep the cell open. If A counts visits and B counts people, either find a shared measure or discuss the measures separately.
The TASO briefing shows that deeper case studies may use more sources and methods to test explanations.
This document matrix is a modest first pass. It cannot establish a causal effect, a statistical difference, or a formal qualitative comparative analysis result.
If a project collects survey results alongside interviews, plan how those two strands will be brought together instead of treating this document matrix as their integration. The convergent mixed methods design guide shows how to compare separately analyzed qualitative and quantitative findings while keeping disagreement visible.
When the evidence is strong enough, write the narrow finding that answers your question. Keep the counterexample and unresolved cells beside it. A reader can then follow your reasoning from the claim back to each case. If the next assignment asks you to defend a stance and answer objections, the position paper guide shows how to turn that checked evidence into an argument.
Atlas
Compare selected sources in Atlas
Compare selected sources, inspect citations, and save checked findings.
Frequently Asked Questions
It is a structured way to examine two or more cases or sources against a shared question, identify similarities and differences, and explain what the supported comparison means.