

Factorial research design sets out how several factors and their levels form study groups or test settings. To read a paper, start by mapping those settings. Then check which source text supports the map and what the labels leave open.
A factor-level-combination note keeps each factor, its levels, how the study crossed them, and where the paper gives those details. Keep run order and mean scores in their own fields. That makes a claim without enough support easier to spot.
The worked map below uses NIST's ceramics example. We wrote the map as a teaching aid from the source text and table. It supplies no new test, data, or claim about the best settings.

Trace factor levels to study passages
Check the design map before interpreting study effects.
What factorial research design describes
A factor is a variable in the design, and its levels are the chosen settings or groups. A treatment combination uses one level of each factor. A full factorial design includes every such choice across the levels.
The NIST full-factorial guide shows three two-level factors with eight combinations. The count refers to distinct settings. Repeat runs or added center points are other details that may change the total count of data rows.
Read the notation before the effects
A two-by-two full design has two factors with two levels each and four combinations. This label says how the levels are crossed. The methods and data text must tell you how many study units and repeat measures supplied each group.
A main effect is a factor's effect averaged over other factor levels. An interaction asks whether that effect depends on another factor's level. The academic teaching chapter explains these terms. The grid alone does not prove either result.
Prepare the source and evidence map
Use a short evidence checklist before reading results. Name the exact source, the test or data it describes, the factor list, the code key, the treatment choices, and what was measured. Add a page or section beside each entry so a reader can check it.
Fix the example's scope
The NIST ceramics page gives its own analysis of a changed part of original high-performance ceramics data. It names Said Jahanmir and Lisa Gill as the original researchers. Its example covers sintered reaction-bonded silicon nitride.
Keep that scope in the note title or source field. Our map reads the example on the page. We have not obtained the unchanged original data or read all tests in the larger ceramics project.
Keep labels and units intact
Copy the factor labels and level values before making them shorter. A speed, a group, and a batch label carry different meanings. The Jim Frost guide gives a plain account of these design parts.
Use the primary source for the actual test. In the ceramics example, the down-feed field gives values in millimeters. Keep that unit as reported. Changing it to millimeters per second would add a detail that this page does not give.
The Kendra Cherry guide also explains factor-level notation. Those general examples can help a reader get started. Use the study itself to check its settings, codes, group assignment, and results.
Worked map from a ceramics example
NIST reports five factors at two levels each and a complete design with thirty-two observations. This map keeps the two level labels listed for each factor. It adds a reading check and leaves effect sizes and best settings open.
| Reported factor | First listed level | Second listed level | Source-reading check |
|---|---|---|---|
| Table speed | 0.025 m/s | 0.125 m/s | Retain the speed unit. |
| Down feed rate | 0.05 mm | 0.125 mm | Preserve the source's reported unit. |
| Wheel grit | 140/170 | 80/100 | Keep the category labels intact. |
| Direction | Longitudinal | Transverse | Read these as named directions. |
| Batch | 1 | 2 | A batch label alone does not explain assignment. |
Table 1: Values come from the factor list above the NIST design matrix. This is our partial teaching map of that source. The first and second level columns keep its listed order. Code signs have no fixed meaning across studies.
Separate design rows from actual order
The matrix uses five coded factor columns in the same factor sequence as the map. Its first design row is (-1, -1, -1, -1, -1), and its actual-order field is 17. That row was not the first run merely because it appears first in the table.
Design row 18 is (+1, -1, -1, -1, +1), with actual order 1. The two fields answer different questions: which setting is listed, and where that run falls in the reported order. Keep both fields when you write a methods note.
The NIST standard-order guide explains how combinations are listed. Actual run order needs its own evidence, even when a familiar table pattern appears in the paper.
Preserve the reported response summary
The ceramics page says each strength value is a mean over 15 repetitions. Keep that statement beside the response field. It tells you how the reported value was formed. The thirty-two treatment combinations describe another part of the study.
A draft claim such as "the whole factorial design had fifteen independent replications" goes beyond that sentence. Keep the reported mean in the checked note. Leave the groups and links among the underlying repeats open for further review.
This correction helps before reading any fitted effects. A mean score does not tell us which repeats came from separate units. We do not use the map to compute error bounds or judge the source analysis.
Check what the grid leaves open
A clean table can still hide missing method details. Read the source text for these questions. Keep a gap as a gap when the supplied text cannot settle it, and state which files or sections you checked.
Full designs and chosen fractions
A full design includes all combinations of its chosen levels. The NIST fractional-design guide describes using a chosen fraction of those combinations. That planned subset needs a reason for its design.
A missing cell in a table does not by itself prove a fractional design. The table may be cut short, a run may be absent, or the paper may describe another structure. Find the authors' design text before adding the label.
Fractional designs can also make some effects hard to tell apart under the chosen structure. The NIST aliasing example shows an effect sharing its estimate with another. Keep any reported alias pattern for review with a statistician.
Units, repeats and assignment
Read what received a factor setting: a person, specimen, batch, session, or some other unit. Then check which data came from the same unit. Several measures can share a setting without being assigned on their own.
The NIST guide to nested variation shows how the way a test is run changes its unit and error structure. Some settings are harder to change and may be assigned at a different level. The grid cannot answer that question alone.
In the ceramics map, batch is one reported factor. That fact alone does not prove a split-plot design or tell us how the run order was chosen. Keep the label, then seek the text on how the study was run. The name cannot fill that gap.
For broader checks on what changed, who or what received it, and what the control did, use the experimental research design guide. Those questions help keep the levels in the map tied to the study's actual units.
Review factor sources in Atlas
Add the papers and design text you are allowed to use. Wait for source processing and check that the methods and grid are readable. The source-synthesis workflow helps keep each source's claims visible during this review.
Start a fresh chat and mention the chosen sources with @. Ask for factor names, levels, units, treatment choices, actual-order evidence, and measured outcomes, each with citations. Leave unknown fields open. Project only limits new retrieval, while prior chat context remains relevant.
Open the cited source and read the text around the claim. Use exact passage navigation where available, or read the relevant section directly. Check the grid headings as well as the prose. Correct any guessed unit, code meaning, or claim about repeat runs.
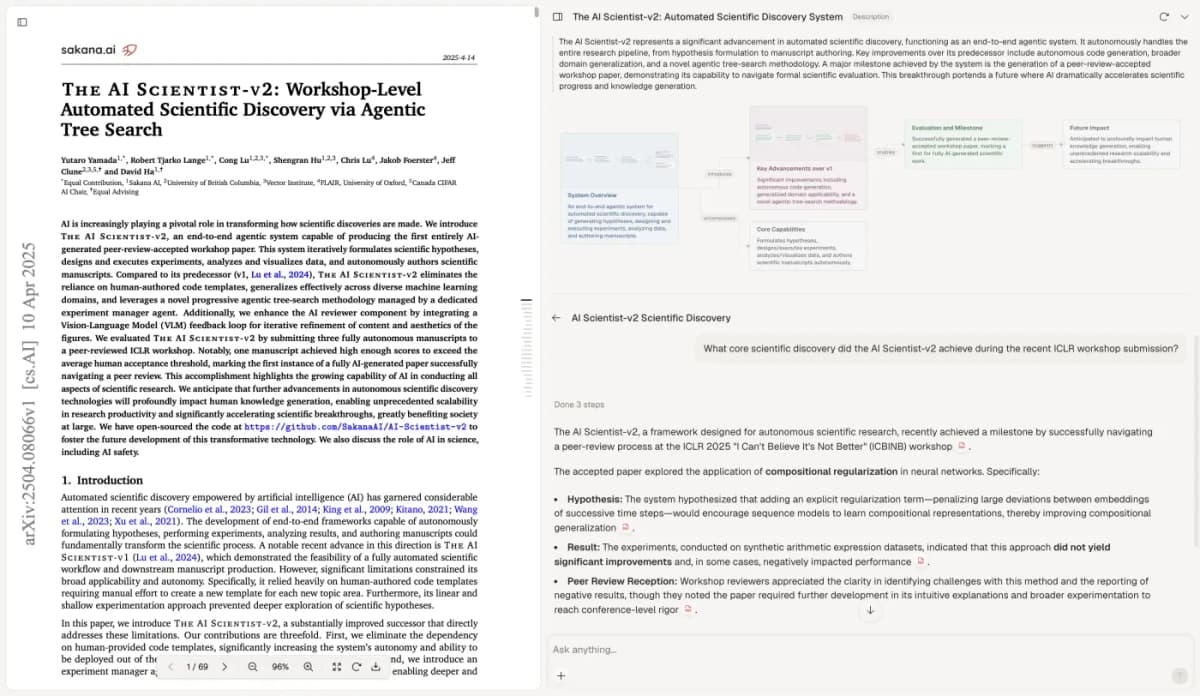
This capture displays The AI Scientist-v2 by Yutaro Yamada and colleagues, licensed CC BY 4.0. This unchanged view illustrates source inspection. It shows no factorial test or ceramics result. The map is a separate teaching aid. No author endorsement is implied.
Keep interpretation with the researcher
Save the checked map through New, then Note. Give it a title that names the source and example, enter the factor rows and open questions, and wait for Saved. The research-note guide helps keep such checks easy to find.
Include the source version, checked sections, code key location, run-order field, and wording for the mean score. If an extra file was out of reach, say so. A note that names its limits is easier to update than a broad claim that the whole design was checked.
Before comparing papers, check whether their factors use the same labels, units and study scope. A shared name can hide different settings. The literature review process gives these source checks a place within the wider review.
Keep the design map apart from claims about results. It can support the next talk with a supervisor or statistician. It does not prove a causal effect, independent errors, a significant interaction, or the best setting.
Researchers decide which model, contrasts, assumptions, and design claims fit the work. Atlas supports the reading and note-building steps. Return to the source when a claim needs more evidence, and keep open questions beside the map.
Trace factor levels to study passages
Check the design map before interpreting study effects.