

Measurement invariance asks whether a measure works in the same way across groups or times. If two groups answer the same scale, you still need evidence that the scores mean the same thing. A shared scale name does not settle that question.
This matters when a paper compares scores across languages, age groups, or study waves. A score gap may reflect a trait difference, a change in how the scale works, or both. Read the model steps before you accept the claim about groups.
The worked report shows how to map those steps and keep gaps in view. It helps you read a study. It does not fit a model or prove that a scale works.

Check the evidence behind a group comparison
Trace each model step and its limits back to the paper.
What measurement invariance asks
The question concerns the measure. It does not require groups to have equal trait levels. If the scale works in the same way for both, you may study a group difference. That difference need not be zero.
For example, a question about feeling at ease in class might relate to confidence in one group and language fluency in another. The item wording can be the same while its relation to the target trait changes.
The Berkeley D-Lab guide explains why a new language, changed test, or new group can alter how a scale works. A paper should state which groups or times its evidence covers.
This guide reads reported multi-group factor models. Other methods exist. Putnick and Bornstein's review gives the broader case for checking a measure before using it to compare groups or times.
Read the level the authors tested
A factor model links item responses to a trait, called a latent factor. You infer the trait from the scores; you cannot observe it directly. With continuous items, a common sequence asks whether more parts of the model can be held equal across groups.
Configural: the same factor pattern
Configural support concerns the same factor pattern. The model links the same items to the same factors in each group. It does not yet say that the links or starting points are equal.
Imagine two groups answering a confidence scale. A shared pattern may be plausible in both groups, yet one item could have a stronger link to confidence in one group. Keep that next question open.
Metric: equal factor loadings
Metric models hold the factor loadings equal. A loading shows how an item relates to the factor in the model. This step adds a rule beyond the shared pattern.
The official lavaan guide shows these models in a worked example. Read the paper's rules and fit judgment. The word “metric” alone does not tell you how the study checked them.
Scalar: equal item intercepts
For continuous items, a common scalar step adds equal intercepts to equal loadings. An intercept is the expected item value when the factor is at zero on the model scale. These rules matter when you compare latent means.
Scalar support does not prove that group means are equal. The multigroup chapter explains how means enter the model. The trait levels can differ while the loadings and intercepts stay equal.
Residual and partial models
Strict models also hold residual variances equal. This is the item variation left after accounting for the factor. Partial models hold some parts equal while freeing others. Note what was freed and why. “Partial” does not make every score fit for comparison.
Find the groups and model details
Read the methods and result tables together. A claim that “invariance held” can leave out the tested level, groups, or changed rules. Keep those details in your note before judging the claim.
Locate the comparison
Find the groups, sample sizes, language, test version, and test times. Were groups defined before analysis? Did they use the same items and answer options? Keep any changes beside the group label.
Note whether the paper compares a latent mean, a raw total score, or links with another score. These are distinct targets. Evidence for one need not support all three.
Read the model sequence
List the reported models, what was held equal, and how the authors judged the added rules. Keep the fit results and their reasons as stated. Do not invent a missing cutoff or replace the study's judgment with one rule of thumb.
If a paper stops after metric testing, it has not reported scalar support there. If it tests scalar rules and finds problems, keep those results. A missing test and a test with poor fit call for different next questions.
Check ordered response items
Ordered response options need thresholds and further model choices. A threshold marks the boundary between two answer options in the model. Read levels of measurement to distinguish ordered options from a continuous score.
The original Wu and Estabrook paper shows that model setup for ordered data can change which rules are tested and what they imply. Do not copy the continuous-item steps without checking the data type and model setup.
Map a fictional paper's evidence
Imagine a fictional study of the same confidence scale in two student groups. The authors model its items as continuous. They report configural and metric support but no scalar test. This example gives no real data or fit indices.
The table maps each reported detail to the claim it can support and the question still open.
| Fictional report detail | Evidence level or scope | What the note can say | What remains open |
|---|---|---|---|
| Same item-to-factor pattern fitted in both groups | Configural | Authors support a shared pattern under their fit criteria | Equal loadings and intercepts are separate questions |
| Equal-loading model judged acceptable | Metric | Authors report support for their loading constraints | This alone does not establish scalar support |
| No equal-intercept model reported | Scalar not reported | No scalar conclusion is available in this material | Locate another report or ask for the missing test |
| No residual-equality test reported | Strict not reported | Do not assert strict support | Whether this matters depends on the comparison target |
| Paper compares raw totals across the two groups | Observed-score claim | Record the authors' comparison without certifying it | Check the justification for this outcome and model |
Table 1: These are fictional reporting details, not empirical results or universal model-fit criteria.
Repair the mean-comparison claim
The claim that metric invariance permits every group mean comparison goes beyond the report. A more careful note would record metric support for this model and these groups. The paper gives no scalar evidence for the usual test of latent mean differences.
The revised claim does not say scalar testing failed. It says the step was not reported. It also leaves the raw-score claim open. That target needs its own support; do not silently switch from latent factors to raw totals.
Keep partial constraints visible
If another report frees one intercept, record the item and the change. Keep the reason and the target comparison. The lavaan partial-model example shows specific parts being freed. It does not make every partial model fit for every use.
A paper-analysis note can keep those details beside the authors' claims. If two papers use distinct versions or groups, do not merge their support into one broad label for the scale.
Check the evidence map in Atlas
Create a project with the study report, group definitions, model details, and supplements. Wait until the sources finish processing. Add the reports with later model steps. Do not ask Atlas to infer those steps from an abstract.
Start a chat and type @ to select the sources. Ask: “Map each reported model step. Give the groups, test version, item type, rules, finding, limit, and citation. Keep missing steps apart from tested failures. Do not certify group comparisons.”
Open each numbered citation. Check the model name against its rules and the groups used. If the answer turns metric support into scalar support, ask for that result passage. Correct the map if the source does not supply it.
The screenshot shows a real Atlas answer beside an open AI-science source. It shows citation checking, not CFA output or a test of the fictional scale. In your project, check the open passage against each row of your map.
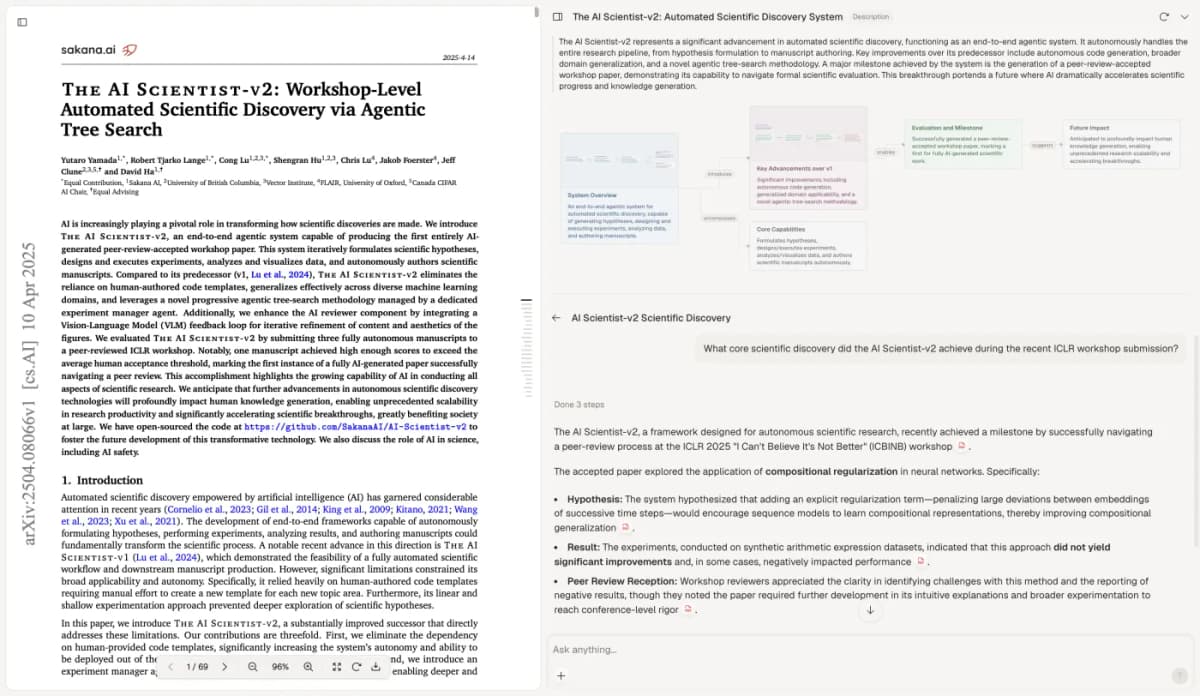
Open the cited result and read the tested constraints before keeping a group-equivalence claim.
The visible paper is Yamada et al.'s AI Scientist-v2 study, licensed CC BY 4.0. Its page appears unchanged within the Atlas capture.
Choose New, then Note, and save the checked map. Include source locations, group definitions, test version, and any freed constraints. Wait for Saved before closing it.
Atlas supports reading and notes from supplied sources. It does not fit models, test invariance, or establish causality. In a literature review, retain each study's group scope so later synthesis does not turn local support into universal comparability.
Keep the claim within its scope
Evidence that a scale works the same way across groups differs from evidence that scores repeat well. Reliability versus validity explains the split. Scores may repeat well in both groups while the cross-group question stays open.
Content and construct evidence concerns what items cover and what scores mean. Those findings add to the case for the scale. They do not replace the group check the paper needs.
In a paper summary, name the reported level, groups, model, and target comparison. Revisit the map when the scale, language, group, time point, or model rules change. Keep untested and uncertain claims in view.
Check the evidence behind a group comparison
Trace each model step and its limits back to the paper.