

Levels of measurement describe what values mean: labels, ordered values, equal gaps, or equal gaps with a meaningful zero. The four names are nominal, ordinal, interval, and ratio. A number in a spreadsheet can belong to any of them.
To assign a level, read the field and its coding rules. “Age” could mean time since birth or a set of age bands. These formats keep different details even though they refer to the same quantity.
The worked note helps you check what the source says before choosing a level. It helps you read study fields; it does not choose a test or change your data.

Check what your recorded values mean
Compare field definitions and scoring rules before interpreting the scale.
What the four levels mean
Nominal values label categories with no inherent order. A department code can tell you which department a person belongs to. The numbers 1, 2, and 3 would still be labels if you renamed them A, B, and C.
Ordinal values have an order but do not establish equal gaps. First, second, and third place tell you who ranked higher. They do not tell you how far apart the performances were.
Interval values have meaningful equal gaps, but their zero does not support ratios of the measured quantity. A change from 10 to 20 degrees Celsius is the same temperature gap as 20 to 30. It is not a doubling of temperature.
Ratio values add a meaningful zero. For elapsed time, zero means no duration has elapsed, and 20 minutes is twice 10 minutes. OpenStax's scale-level lesson explains this four-level distinction with examples.
Read the coding rules first
Start with the methods, test guide, or data dictionary. Find the field's meaning, units, valid values, and missing-value codes. A column name helps you find the right passage. It cannot settle the scale level alone.
Check category and order
Ask whether values distinguish categories or encode an amount. If they are categories, can you rank them in a way that the source defines? Department numbers have no inherent rank; low, medium, and high duration bands do.
The GraphPad guidance explains why a numeric label does not create a meaningful average. If you change department codes and the mean changes, the arithmetic is tracking the labels, not an amount of department.
Check gaps and zero
For ordered values, ask whether equal steps mean equal amounts of change. A one-step change on a rating need not mean the same thing at every point. Find the reason for the scoring rules rather than assuming equal gaps from the printed numbers.
Then ask what zero means. Does it mark no quantity, a chosen reference point, the lowest permitted response, or missing data? Only the relevant quantity's zero supports the ratio claim. “No answer” coded as zero is not a zero amount of the trait.
Record the reason for the label
Link the level to the field's rules in your note. Write: “Ordinal because the groups have an order but the guide does not establish equal gaps.” This gives more detail than a bare label. You can revise it if you find more scoring evidence.
This focus on coding rules follows Stevens's original paper. A variable definition should state how the values stand for the concept you want to study.
Classify a fictional study's fields
Imagine a fictional student study with these six fields. No real student values are given. The examples show how coding and units affect the level. They do not show an analysis of real data.
Read each field's actual format before using its familiar name to infer a scale level.
| Fictional recorded field | Category or order | Equal-gap evidence | Meaning of zero | Classification |
|---|---|---|---|---|
| Department code 1, 2, or 3 | Unordered labels | Codes do not represent amounts | No zero category defined | Nominal |
| Place in a writing contest | Ordered ranks | Rank gaps do not show performance gaps | No zero rank defined | Ordinal |
| One agreement item, strongly disagree to strongly agree | Ordered responses | Equal gaps not established | Lowest response does not mean no trait | Ordinal |
| Room temperature in degrees Celsius | Ordered readings | Celsius increments have equal temperature gaps | Reference point rather than no temperature | Interval |
| Elapsed study time in minutes | Ordered amounts | Minutes have equal duration gaps | No elapsed time | Ratio |
| Age bands, under 20, 20–29, 30 or over | Ordered categories | Unequal and open-ended ranges | No zero-age value retained | Ordinal |
Table 1: The table classifies hypothetical recorded formats; changing the format can change which information is preserved.
Repair a code-as-quantity claim
Suppose a note says: “Department is interval because it is stored as 1, 2, and 3.” The source gives those values as labels. Subtracting one code from another does not measure a difference in department.
Repair it to: “Department is nominal in this study because the numbers label unordered groups.” Keep the data-dictionary passage beside the correction so another reader can check the coding.
Preserve the recorded format
Exact age as time since birth can support ratios. The bands above do not keep those exact times. The BCcampus methods chapter explains how coding rules affect what a score can tell you.
Do not label the bands ratio just because exact age is a ratio quantity. A paper-analysis note should keep the field used in the study. It should not replace that field with more precise data the team could have collected.
Check ratings and changed formats
A rating item with ordered options usually supplies ordinal data. The distance from “disagree” to “neutral” need not equal the distance from “neutral” to “agree.” Numeric coding does not establish those gaps.
One item versus a combined score
A scale that adds several items raises further questions about its score. Researchers may treat the gaps as equal for a given analysis. The level of one item alone cannot tell you whether that choice fits the combined score.
Find the scoring guide and why the study used it this way. “Treated as interval” does not mean “proved to have equal gaps.” Reliability versus validity shows why a score that repeats well need not prove its meaning.
A zero code versus a zero amount
If zero codes a skipped question, it cannot support a ratio claim. It tells you that an answer is missing, not that the quantity is absent. Keep those codes apart from valid scores.
If zero is the lowest scale score, ask what it represents. A person who chose every lowest response has not necessarily shown an absence of the trait. Content and construct evidence helps you examine the case for that interpretation.
Scale level versus test choice
The scale level helps you read the values. It does not choose a test on its own. Your question, study design, links between cases, and the model's assumptions also matter.
The official GraphPad guide presents levels as one part of choosing an analysis. In a literature review, keep the authors' methods in view. A scale label alone does not prove they fit the study.
Save a source-checked note in Atlas
Create a project with the study methods, variable definitions, and instrument guide. Wait until each source has finished processing. A guide for another version can use different coding, so name the version you need.
Start a chat and use @ to select the sources. Ask: “For each recorded variable, give its categories, order, evidence for equal gaps, and zero meaning. Cite the definition and scoring rule. Mark unknown properties and do not choose a statistical test.”
Open the citation beside each scale label. If an answer calls department codes interval, find the coding passage and correct the row. If the source says nothing about equal gaps in a combined score, keep that question open.
The capture shows a real Atlas answer beside an open AI-science source. It shows citation checking, not results for the fictional study. You would check the open source text against each row of your own note.
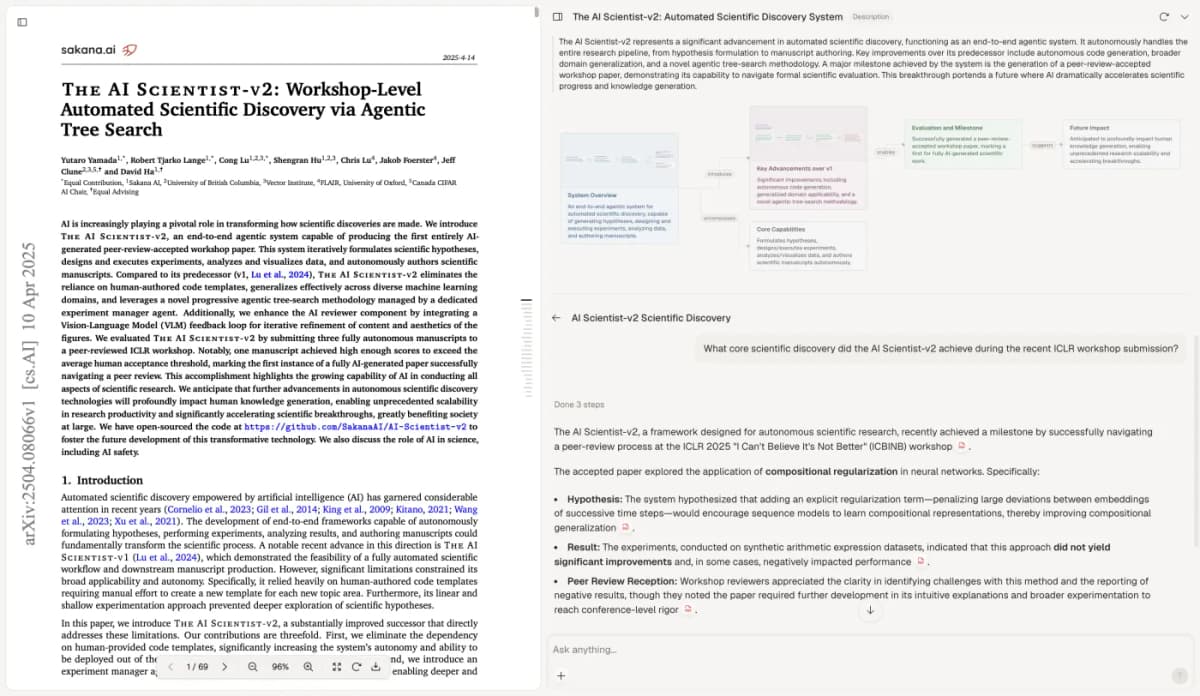
Read the definition and coding rules in the source before keeping the proposed scale level.
The visible paper is Yamada et al.'s AI Scientist-v2 study, licensed CC BY 4.0. Its page appears unchanged within the Atlas capture.
Choose New, then Note, and save the corrected classification. Include the field, format, units, missing codes, source location, and any assumption still open. Wait for Saved before closing it.
Atlas can help compare supplied source descriptions and retain your notes. It does not transform your data or run the analysis. Keep methods judgments separate when making a research-paper summary.
Keep the assumptions with the field
Before using the note, read the field as it appears in the actual study. Does the source support the assigned order, gaps, and zero? If not, mark the missing property instead of filling it from a general example.
Revisit the classification when a variable is binned, a score is combined, or a missing-value rule changes. Preserve the rationale so the next reader can see why the label fits this version of the recorded field.
Check what your recorded values mean
Compare field definitions and scoring rules before interpreting the scale.