

Selection bias can arise when who enters or stays in a study skews the answer to its question. To check it, trace how people could join, were invited, joined, stayed, and were counted. Do not stop at the sample size.
This guide uses a fictional campus commute survey to show that trace. It also separates two concerns: a biased comparison within a study, and a claim that reaches beyond the people studied. A count of replies alone cannot settle either concern.

Trace the selection behind the claim
Compare study flow with the population named in the conclusion.
What selection bias means
The CDC methods manual describes selection bias in terms of who gets into study groups and how. If entry depends on both what is being studied and its outcome, the groups may give a false picture. Check how that happens.
A narrow sample is not always a biased answer to a narrow question. A survey of students at one campus might describe those students well. It needs a separate argument to support a claim about all students.
Cochrane’s guidance distinguishes internal selection bias from limits on applying findings elsewhere.
Write down the question and target group before judging the sample. Do authors ask how often something occurs, whether two things are linked, or whether one causes the other? What group does the claim name? A sample trait may matter for one aim but less for another.
Trace the full selection process
Entry and response
Start with the group the study hoped to describe. Then find the group it could reach. A campus email list may omit visiting students; a workplace survey may miss people on leave. Next check who was invited and who replied. Those asked and those who reply are not the same group.
Scribbr’s guide explains undercoverage, volunteer and nonresponse concerns in plain terms. Use those labels to ask a specific question. Could reasons for replying be tied to the view or act being measured? A low rate of replies alone does not tell you which way bias points.
Retention and analysis
Selection continues after entry. People can drop out, miss follow-up, or have incomplete records. A study of only full records may describe a different group from those who joined. Record which people were removed and why.
The Cochrane selection section covers entry, follow-up time and missing data. A note should preserve reasons and timing, not just a total number lost. If reasons are not reported, leave that gap visible.
Worked check of a commuter survey
Suppose a fictional study asks students at one campus how they travel to class. Course email lists are used to ask students to take part. Students reply online. Only replies with all commute items filled in are used. No survey results or rates are supplied here.
Use these four stages to connect the reported process with the group a conclusion can reasonably name.
| Stage | Fictional source statement | Question for the reader | Claim limit to record |
|---|---|---|---|
| Eligibility | Enrolled students at one campus | Are other campuses part of the intended claim? | Do not silently extend to the whole university |
| Invitation | Course email lists were used | Which students were outside those lists? | Reach may differ from eligibility |
| Response | Students chose to reply online | Could commute concerns affect willingness to respond? | Mechanism and direction remain uncertain |
| Analysis | Only complete commute replies were analyzed | Why were some responses incomplete? | Final sample differs from everyone who replied |
Table 1: The trace is fictional; a real note should cite the report or protocol for each stage.
Narrow the population claim
A draft summary might say, “The survey shows how all university students commute.” That exceeds the described scope. Start with “The analysis describes commute replies from students at the surveyed campus who completed all required items.” Add actual dates and findings only when the real paper supplies them.
This change does not prove the result is free from bias. It makes the named group match those who were counted. A paper-analysis workflow helps you keep scope, methods and results separate instead of letting a broad title control the summary.
Leave the mechanism unresolved
Perhaps students with long journeys are more likely to reply because commuting matters to them. Perhaps they are less likely to reply because they lack time. Those are rival possibilities, not findings. Look for facts about those who did and did not reply before choosing one.
Record “response reasons not reported” when that is what the paper supports. The CDC interpretation guidance calls for reviewing study design and other explanations before making a causal claim. A neat risk label does not measure the size of a problem.
Separate bias from limits of reach
Collider and confounding concerns
A collider is a factor affected by two other factors. Restricting a study to one value of it can create a false link between those factors. For example, if both an exposure and a cause of the outcome affect who joins, looking only at those who join can change the link you see.
Elwert and Winship’s review distinguishes this from confounding due to a shared cause. More adjustment is therefore not always better. Ask a trained analyst to map the causes before choosing what to control for.
Scope and possible remedies
If a study answers a question about volunteers, do not declare it useless simply because volunteers differ from everyone else. Ask whether the result fits its aim and whether the authors extend it to a group they did not study. Cochrane’s internal-bias distinction helps keep these judgments apart.
A larger sample can give a tighter estimate while the flawed entry process stays the same.
Weighting, imputation or sensitivity analysis can help in suitable cases, but each needs data and assumptions. They cannot fill in what was never measured just by claiming to do so.
The author-hosted expert review is a starting point for deeper causal reading, not a recipe for every study.
Build a limitation note in Atlas
- Add the paper, protocol, records of who joined and stayed, plus methods guidance to one project. Use material you have the right to share. Mark which files belong to the same study.
- In Ask a question, use @ to select those sources. Ask: “Trace eligibility, invitation, response, follow-up and final exclusions. Cite each statement. Compare the final group with the conclusion. Separate possible bias mechanisms from reported facts.”
- Open each citation and read the surrounding text. Check whether counts refer to those asked, those who joined or those counted. If a reason is missing, ask for the passage that gives it. Keep the gap if none can be found.
- Narrow the broad commute claim and keep the reasons for replying marked as unknown. Use a source synthesis approach to keep protocol plans apart from what the report says occurred.
- Create New → Note, save the checked trace and the unresolved questions, then wait for Saved. This note aids reading. Atlas does not measure the bias or prove that a chosen fix removes it.
The image shows a source beside a cited answer. Read the two together when checking a selection statement. Its visible paper concerns AI research and is unrelated to the commuter scenario; it does not show an executed bias check.
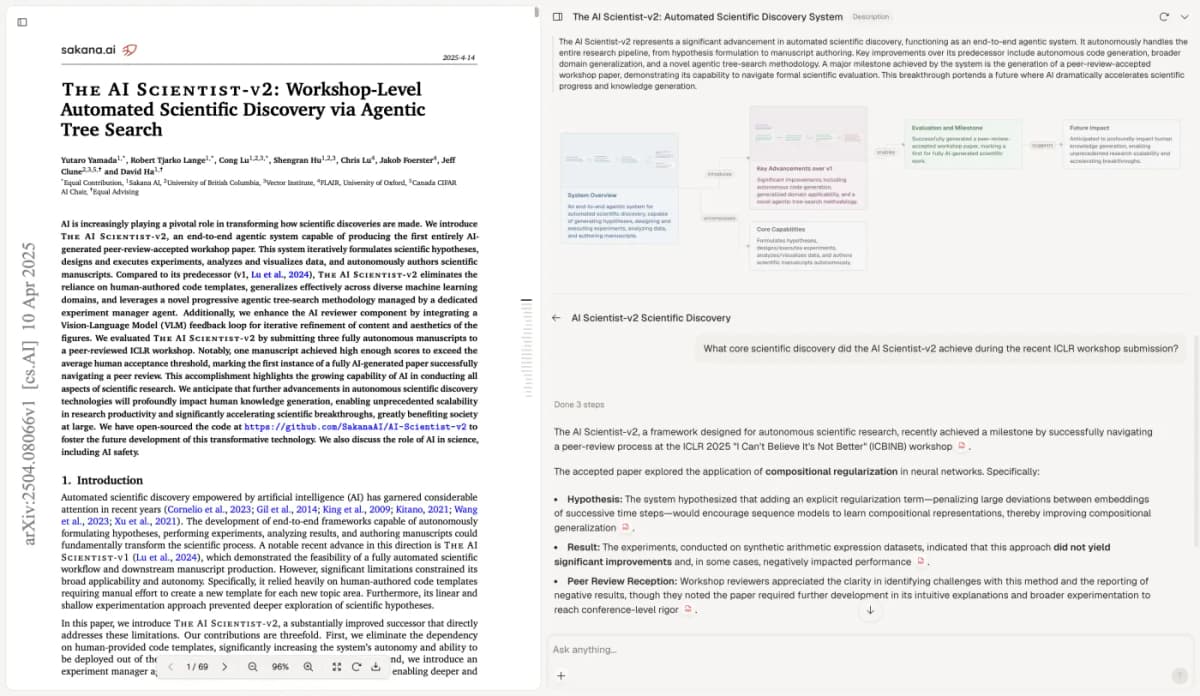
Check reported facts in the source before turning them into a limitation or a causal judgment. The embedded paper is Yutaro Yamada and colleagues' The AI Scientist-v2, licensed under CC BY 4.0. The screenshot is reused unchanged.
Review what the claim can support
Take the note back to the paper. Separate what the source reports, what mechanism could matter, and what remains unknown. Match the named group and dates to the source facts. Ask an analyst to review fixes that need a causal model or data checks.
For several studies, use a bounded literature review to compare processes and gaps consistently. Keep each paper’s scope rather than assuming all use “selection bias” in the same way. Scribbr’s vocabulary guide can help name concerns; the design and data must support the final judgment.
Trace the selection behind the claim
Compare study flow with the population named in the conclusion.