

A stepped wedge design rolls out a program to groups in stages. When you read a trial, trace who switched, when the study took its measures, and how the model dealt with time.
Build a cluster-period-rollout evidence table as you read. Keep a source passage with each row so the rollout colors stay tied to the reported rules. This worked example uses a real trial and its source figure. It adds no new tests or scores.

Trace the trial rollout to its sources
Compare the report and protocol, then save a checked rollout evidence table.
What is a stepped wedge design?
In a stepped-wedge cluster randomized trial, clusters start under control and switch to the intervention on an assigned schedule. A cluster is a group, such as a clinic or school. Its sequence sets when it switches.
The NIH methods guide describes how groups are assigned to rollout schedules and outcomes are measured over time. In a typical full rollout, all groups get the program by the end. That does not prove it helped.
A phased rollout alone does not make a randomized trial. Check how the order was chosen. The cluster randomized trial guide explains when a study assigns whole groups rather than each person.
Time also matters. More groups get the program as the trial goes on. Their outcomes may change for other reasons in those same months. Read how the model handles time alongside the rollout plan.
Read the clusters, periods, and rollout sequence
Read the design and group assignment before the results. Keep the figure beside them. What does each row or column mean? Which data does the study use to compare the groups?
Identify the unit and the assigned sequence
Name the cluster first. Then note how many groups there are and when they switch. Several groups can share one sequence. Their schedule is the same, but their data still come from distinct groups.
The stepped-wedge CONSORT extension asks authors to describe these details and show them in a diagram. Find how the order was chosen, too. Picking sites that are ready first is not the same as assigning the order at random.
Read across a row to follow one group over time. Read down a column to compare groups at the same time. A step marks a switch in condition. It does not mean the study recruited a new set of people.
Check who contributes observations in each period
The 2025 methods overview by Li, Wang, and Heagerty describes three sampling forms: cross-sectional, closed cohort, and open cohort. These terms tell you who is measured. They do not count the rollout steps.
In a cross-sectional trial, each period can sample new people. A closed cohort follows a set group. An open cohort lets people leave and join. Check which form the paper uses before assuming each cell holds the same people.
Keep the timing of measures separate from the rollout. A program can start before its full effect can be measured. Read the transition rule: how does the study use data from the changeover? Shading alone does not answer that.
Trace SHAREHD across its reported periods
Fotheringham and colleagues' SHAREHD report describes an 18-month closed-cohort trial in 12 renal centres. Six centres switched early and six late. Here, the task is to read the design. The example offers no advice about dialysis care.
Keep calendar periods and exposure rules together
The table follows Figure 2 and four named sections: Study design, Randomisation and masking, Outcomes, and Statistical analysis. It keeps the figure's dates and checks the transition rule in the text.
| Source period or rule | Reported cluster rollout | Evidence to keep with the entry |
|---|---|---|
| Baseline: October 2016–March 2017 | Figure 2 begins both sequences under control; the early sequence has a transition segment near the end | Figure 2 plus Results, which says early delivery began in January 2017 |
| Step 1: April–September 2017 | Early sequence is shown under intervention; late sequence remains control before its transition segment | Figure 2 plus Results, which says late delivery began in July 2017 |
| Step 2: October 2017–March 2018 | Both sequences are shown under intervention | Figure 2 and the 18-month Study design description |
| Transition observations | Observations obtained during transition were assigned to control | Outcomes section; do not recode them from delivery dates alone |
Table 1: The Results section says delivery began in January and July. The figure groups time into blocks ending in March and September. Keep both. A program start date does not mean every measure from that point was coded as intervention.
Read the rollout figure and legend
Figure 2 shows 12 cluster rows in two sequences, 011 and 001. White denotes control, light blue transition, and dark blue intervention. The early six clusters transition before the late six; both groups end under intervention.
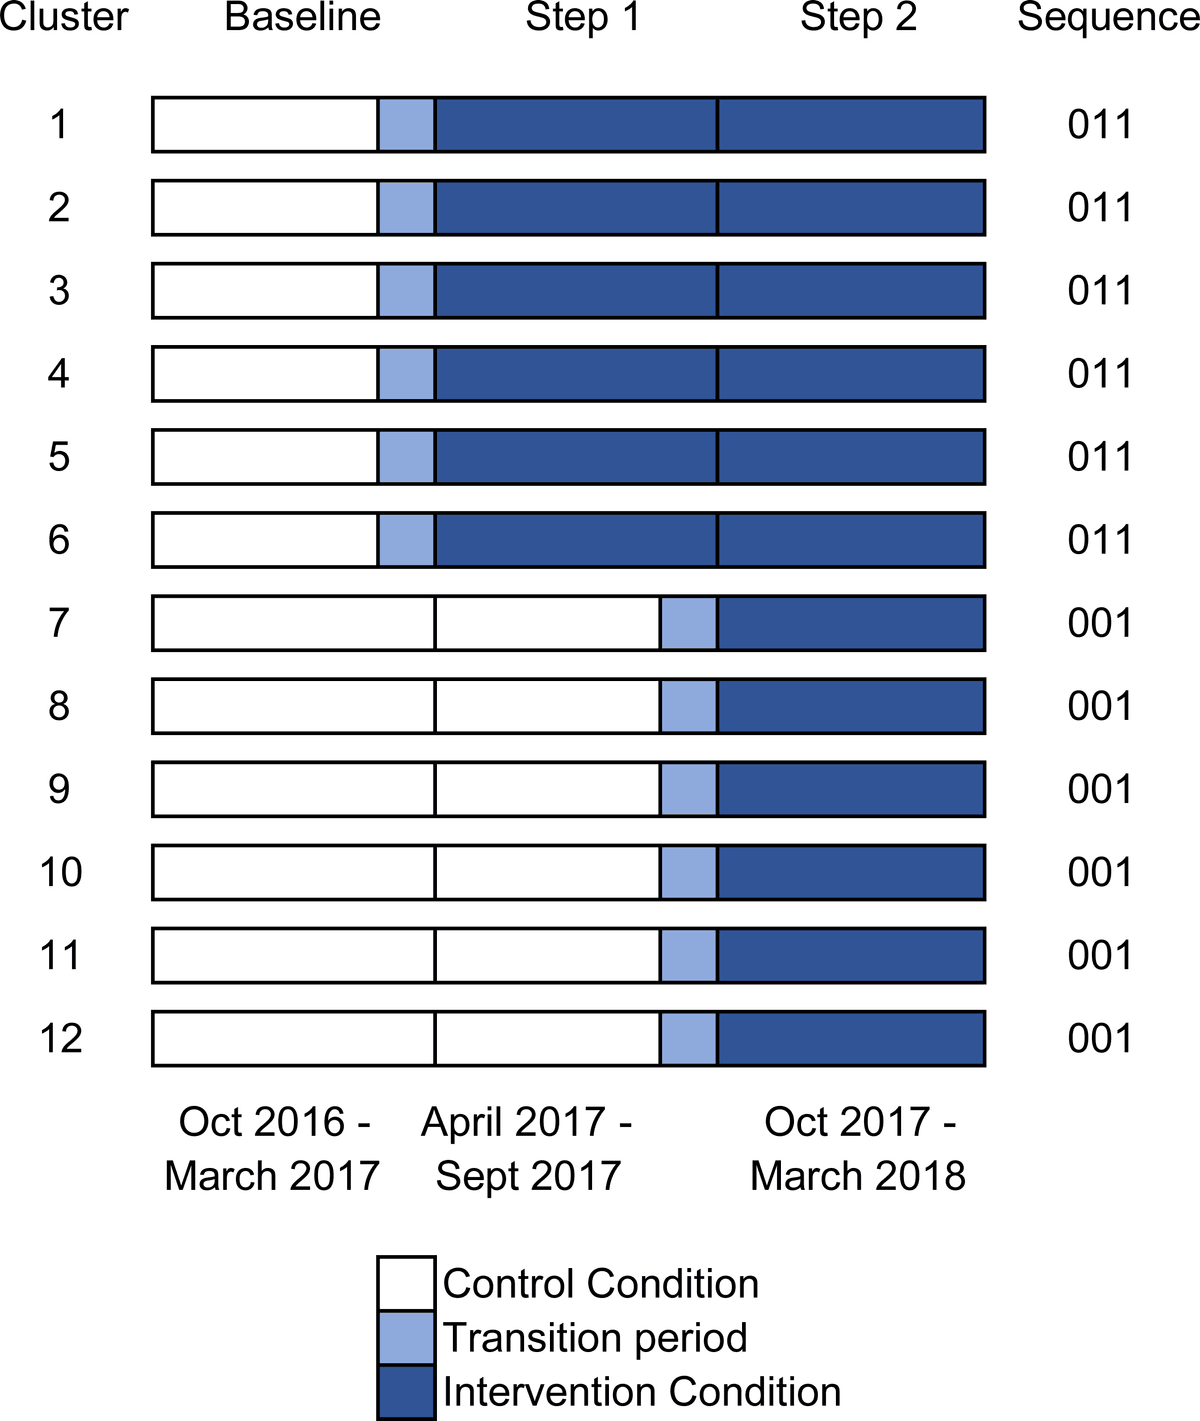
Original Figure 2 from Fotheringham et al., PLOS ONE, 2021. Complete unchanged publisher image, CC BY 4.0.
The legend shows a transition state that a two-color summary could lose. The Outcomes section explains how those data were coded. This trial's choice is not a rule for every study.
The original SHAREHD protocol sets out the planned design and measures. A document comparison workflow can keep the plan beside the report. Keep the date and version of each source. Mark gaps rather than filling them in.
Check time and clustering in the analysis
The design shows where the data come from. The model shows how the study uses them. Find the time terms, treatment coding, and rules for related data before you write an effect claim.
Separate calendar time from time since exposure
Calendar time counts months or periods in the study. Exposure time counts how long a group has had the program. Two groups measured in June can have spent quite different lengths of time in it.
The NIH time-confounding guidance explains why time matters: control data tend to come from earlier dates. A change in the season or wider service can overlap the rollout. Assigning the order at random does not remove this problem.
Nickless and colleagues' study using simulated data tests models with several patterns of change over time in closed-cohort trials. Read the assumed patterns when using its findings. One set of tests cannot choose a model for all trials.
In SHAREHD's Statistical analysis section, time is counted in months from baseline. The authors give results with and without time adjustment. Keep each result with the model it came from.
Trace clustering and the reported comparison
People at one centre may have related outcomes. Several measures from the same person can also be related. When the trial follows people over time, check how it handles both links.
The SHAREHD methods use centre and patient random intercepts. These let the model allow each centre and person a distinct starting level. That choice does not show that the same model fits another trial.
The report keeps the change from baseline to the end distinct from the model's effect estimate. Its Discussion says the combined primary endpoint rose, but the adjusted effect was not statistically significant. Keep both findings in your note.
A source-checking workflow can catch a summary that turns the raw change into a stronger claim. Read what was measured, the estimated effect, its uncertainty, and the time terms together. Keep the favorable finding tied to the comparison the model estimated.
Keep the evidence table within its scope
The table shows where claims about the design and model came from. It helps you read. It does not test the random assignment, fit a model, or prove that the program caused a change.
Check whether the rollout followed the plan and where data are missing. SHAREHD's reported limits include missing data and unblinded assessment. The authors also note that collecting task data may have changed behavior under control.
More groups get the program by the end. That does not make a pooled before-after change the trial's effect estimate. Keep the comparison and its limits attached in a research synthesis workflow.
Use the CONSORT extension's analysis items to find how the paper handles time, clustering, and repeated measures. Finding these details does not prove the model's assumptions hold. This reading note is not a full reporting audit.
If the sources do not explain a transition or time term, mark the gap. Note which passage you still need. Seek statistical review for model judgments. Comparing sources cannot approve a design or resolve a gap without evidence.
Save a rollout evidence table in Atlas
Atlas can help compare the report, protocol, and rollout records you may use. Focus on what the sources say. You must check the meaning and do any statistical work through an appropriate method.
- Add the report, protocol, and needed supplements to one project. Wait until each source has finished processing.
- In chat, type
@and select those sources. Ask for groups, rollout dates, transition rules, time terms, and a citation for each. - Open each citation and read the full passage. Correct mixed dates, guessed coding rules, and claims stronger than the model supports.
- Select New, then Note. Save the checked table, source pages or sections, and open questions. Confirm Saved before closing it.
Try this request: “From @selected sources, trace the trial's rollout groups and when data were collected. Keep start dates separate from how transition data were coded. Cite the rules for time and clustering. Mark gaps or conflicts. Do not fit a model or claim proof of cause and effect.”
Trace the trial rollout to its sources
Compare the report and protocol, then save a checked rollout evidence table.