

Test retest reliability asks how well the same test gives the same people stable scores over time. That claim makes sense when the trait being measured should stay much the same during the gap.
If people have changed, a score change may be real. Read the time gap, test rules and type of result before you judge the study. A high number on its own leaves those questions open.
Build a cited note from the paper and study plan. Atlas can help you compare the parts you need to check and save a note that keeps each claim tied to its source.

Check a study's stability evidence
Compare schedules and reported results, then save the limits with source links.
What test retest reliability measures
The design asks whether scores hold up when the test is done again. The OMERACT definition assumes no true change in the trait being measured.
That premise needs a reason. Find what the authors expect to stay stable in this group, and why. A scale about long-term preferences and a scale about today's mood may need quite different time gaps.
If mood changes, the new score may reflect the thing the scale aims to track. That change does not, by itself, show a fault in the test. The question is whether the design can tell true change apart from score error.
Also check what was done again. New test versions raise a question about their content, covered by parallel forms reliability. Links among items within one test concern internal consistency.
One person scoring the same saved cases twice may be a study of intra-rater reliability. Each design asks about a different part of the process. A result about links among items cannot stand in for a result about scores across a month.
Read the interval and conditions
Find the length of the gap and the reason for it. A short gap may let people recall their first answers. A long gap gives them more time to change. The Simply Psychology discussion and OMERACT explain this tradeoff.
Then look for proof that the group stayed stable. A claim that seven days is a short time does not prove that each person's health or mood stayed the same. Keep the authors' reason distinct from what they checked.
Compare the instructions, place, way the test was given and rules for scores. For example, a form filled in alone may yield a different result from the same form read aloud by an interviewer. Both use the same words, yet the process has changed.
The original COSMIN study sets out checks for this design. Table 5 covers stability, the time gap, similar test conditions and freedom from the first round's answers or scores.
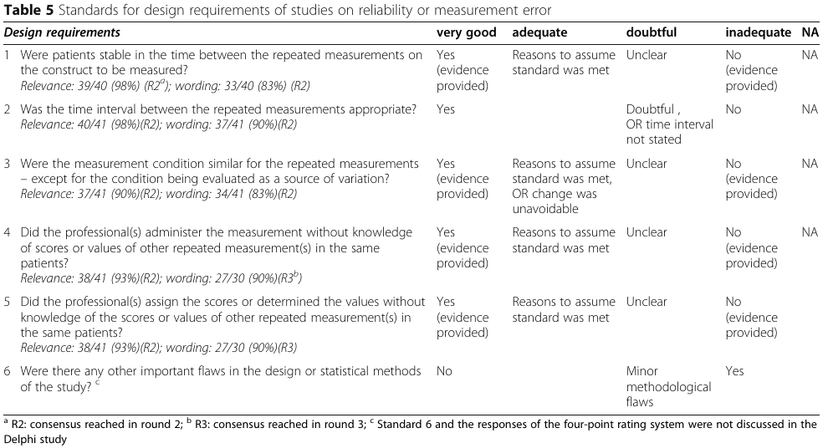
Table 5 is reproduced from Mokkink et al. (2020) under CC BY 4.0. The source PDF was cropped to the table, whose contents are unchanged.
These checks ask what might carry over from the first test. Read the methods text for each one. If the paper does not say whether old answers were hidden, record that gap. Missing detail does not prove that answers were shown or that people changed.
Distinguish correlation from agreement
Pearson correlation describes how two sets of scores move together. People with high first scores may also have high second scores even when all scores have shifted. Statology's example uses this type of result to explain a repeat test.
Consider invented first scores of 10, 20 and 30, then scores of 15, 25 and 35. Adding five leaves a perfect Pearson correlation. Yet each person now has a different score. This is a made-up arithmetic example, not study data.
The distinction matters when the scores guide a choice. If a cut-off lies between someone's first and second scores, the same ranking does not mean the same choice. Check whether the study asks about ranks or about how close the score values are.
For an intraclass correlation coefficient, or ICC, keep the full name and form. Koo and Li explain the choices: the model, one score or a mean of scores, and consistency or absolute agreement. These are technical labels for different questions, so copy them exactly.
Keep the confidence interval with the value. Koo and Li's guidance includes this range in reporting. If the paper omits a detail, leave it open rather than choose an ICC form on the authors' behalf.
A worked stability reporting note
Imagine a made-up plan to give the same eight-item form twice, seven days apart. It uses the same written instructions and reports a Pearson correlation. It says nothing about stable traits or access to old answers. No real scores or people are represented here.
The note below keeps what the plan says beside what it leaves open. It gives you a place to record missing detail without turning that gap into a claim that the design was flawed.
| Detail | Reported information | Interpretation limit |
|---|---|---|
| Measure | Same eight-item version | Supports a same-form design |
| Interval | Seven days | Reason for the gap and stable traits are not shown |
| Conditions | Same written instructions | Other changes in how the test was given are unknown |
| Result | Pearson correlation reported | A link among scores does not show close score values |
Table 1: For a real paper, replace each teaching detail with a page, section or table. Keep the name of the test and the statistic exact. The note can support a claim about linked scores across seven days; it does not show that scores agree in all groups and settings.
Trace the evidence in Atlas
Add the permitted paper, study plan and test guide to one Atlas project. Once you can read them, start a chat. In Ask a question, use @ to select the sources, then ask:
Compare the methods and results for this repeat test. Find the test version, time gap, proof of stable traits, test conditions, statistic and confidence interval. Cite each detail. Mark missing facts as not reported. Do not calculate a new coefficient.
Select Send and open each claim's numbered citation. Read the text around it. A sentence about the same instructions may say nothing about the place, staff or way the test was given. Keep your claim as narrow as the cited text.
If the answer treats the time gap as proof of stable traits, ask which source supports that claim. Read that source and correct the answer if it only names the gap. A citation to a related paper may still leave this study's question open.
Select New, then Note, and save the corrected note with source pages, the value, time gap and missing facts. Wait for Saved before closing. Atlas helps with reading and comparison; researchers use suitable software and their own judgment to choose methods and compute results.
Report only the supported conclusion
Name the group, test version, gap and statistic in your report. The COSMIN research-question elements help keep the scope clear. Say what the authors found, then explain any missing detail that limits how you can use the result.
Keep separate notes for different groups and time gaps. A stable group over a week cannot stand in for a changing group over months. When a supplement or later paper adds a missing fact, update the note and keep a record of what was once unknown.
Check a study's stability evidence
Compare schedules and reported results, then save the limits with source links.