

Convergent validity concerns whether a measure's scores relate to scores for the same or related concepts as theory predicts. A construct is the concept being measured, such as confidence or fatigue. The claim needs more than two scale names that sound alike: read the definitions, scores, and link in the papers together.
This guide shows how to read the source support in a paper and save a checked note. The worked numbers are fictional. Atlas can help compare what each scale means with the findings shown in your papers. Open the cited text and decide what the sources support.

Check the passages behind your validity claim
Compare the measure definitions with the paper's reported evidence.
What convergent validity evidence means
If two scales aim to assess the same concept, their scores should relate as the theory says they should. Related concepts may also show a link, but the reason and predicted size need to make sense. CMS's measurement guidance describes convergent support in terms of related scales or indicators of an underlying concept.
Those findings support a reading of scores in a stated context. It does not prove that the scale works for every group or purpose. Reliability asks whether measurement is consistent; convergent support asks about a theory-based link to other scales. The open psychology methods textbook explains why consistency alone does not prove validity.
Convergent and discriminant evidence address distinct questions. Convergence concerns predicted links with the same or related concepts. Discrimination concerns distinctions from other concepts.
The scale-development primer by Boateng and colleagues treats these as parts of broader scale evaluation, alongside other support.
Read the measures before the coefficient
Start with what each scale claims to measure. A correlation is a number that describes how two sets of scores vary together. It is one way to assess a link between scales.
Check which statistic the paper uses; do not rename a rank-based or model-based result as Pearson’s r.
The number cannot tell you, by itself, whether both sets represent the concept you care about. Use a research-paper analysis note to keep the definition beside the result.
Check definitions and score direction
Find the exact scale name, version, subscale, and scoring rules. A broad well-being total and a narrow stress subscale are not the same just because both concern health. Mark whether the other scale assesses the same concept, a related concept, or something else, and give the paper's reason.
Check what a high score means. A person who feels a task is easy may feel more confident about doing it. So high task confidence can go with low task difficulty.
A negative link is not automatically failed convergence. Read the scoring before deciding which sign the theory predicts.
COSMIN's reporting guide asks authors to state the predicted direction, size, and reason in patient-reported outcome measure studies.
Compare the expectation with the result
Find what the authors thought the link would be, then find the reported statistic, sample, and uncertainty. Did they state that view before the results, or after seeing them? Keep that split in the note.
Do not invent an earlier hypothesis from a discussion sentence that only explains a finding later. Use your theoretical framework to explain why the two concepts should relate, then check whether the paper supports that view.
Original COSMIN risk-of-bias guidance explains how review teams can state their own hypotheses when assessing findings in the paper. Label such a review judgment as yours; do not attribute it to the study authors. It concerns patient-reported scales. Use the lesson about stating your own view clearly; do not claim every field uses the same steps.
There is no single link cut-off that proves all scales valid. Two self-report scales with much the same wording differ from two scales that assess related but distinct concepts. A link can have a different meaning when the method also changes.
Note why the link should be this strong for this pair. If the paper gives no reason, keep that gap in the note. Do not choose a cut-off just because the result clears it.
Worked related-measure evidence table
Imagine a fictional paper testing a new task-confidence scale in students at one college. High scores mean greater confidence. The paper checks how it relates to three other scores from the same survey. We made up each name and r value to teach the reading task. None is a real result or a target to aim for.
The table links each comparison to the claimed concept, scoring direction, and limit on the reading.
| Fictional comparator | Expected relationship | Fictional result in the paper | What the reading note can say | What remains to check |
|---|---|---|---|---|
| Established task-confidence scale | Positive link because both target task confidence | r = 0.62 | A positive link is consistent with the stated same-concept prediction | Source definition, precision, and overlap in item wording |
| Task-difficulty scale | Negative link because high scores mean greater difficulty | r = −0.54 | The sign fits this example's opposite score direction | Whether difficulty is related but distinct, and why this strength was predicted |
| General campus-satisfaction scale | The paper gives no clear theory-based prediction | r = 0.40 | Report the number without relabeling satisfaction as confidence | Missing reason and whether this is a separate validity question |
| All three self-report scores | Same survey and respondent | Shared method is reported | Keep method overlap visible as a possible explanation | Evidence from other methods and further samples |
Table 1: This table uses made-up scales and values to show how to read a report. It does not set cut-offs or show a finding from a real study.
Preserve the concept boundary
The task-difficulty row does not mean difficulty and confidence are the same thing. It means the example gives a reason to expect a negative link. The satisfaction row has a reported number but no clear reason for treating it as convergence. An r value should not erase what each concept means.
Before merging support across papers, check whether they use the same scale version and group. A source-grounded literature review can retain those details so a later synthesis does not collapse distinct scales into one name.
Mark missing precision and method limits
This example does not supply sample size or confidence intervals. Do not create them. Write “precision not supplied in this teaching example” beside the values. For a real paper, locate the sample and reported interval or other uncertainty in the report and supplements.
The same survey can introduce shared response patterns or item overlap. A strong link may reflect the intended concept, shared method, or both.
Broader validation needs support beyond one r value. Boateng and colleagues place construct support within a wider process of scale evaluation; they do not make one comparison a complete certificate.
Repair an overbroad validity claim
Replace “The link proves this scale is valid for all students” with “This study found a link with the named scale that fits the task-confidence claim. The finding applies to the sample studied and has the limits set out in the paper.” The revision keeps the pair and context. It removes a proof claim and a promise about people not studied.
If your note only has a p-value, keep looking for the size of the link and its context. A small p-value does not describe the size of a relationship or explain why the other scale is suited to the question. COSMIN's reporting explanation focuses on the predicted direction and size for this reason.
Keep other measurement claims separate
A link between scales does not prove that their scores can be used in the same way. Nor does it show that a scale stays stable over time or assesses a concept distinct from other concepts. Those claims need their own support.
The open textbook explains why a consistent scale need not assess the right concept.
The methods primer sets out other kinds of support a scale can need.
A weak link can raise a question about definitions, scoring, sample range, timing, or noise. It does not reveal which cause is at work. Preserve alternatives and return to the methods. Your reading note should show the uncertainty rather than choose the explanation that makes the scale look best.
Check measure evidence in Atlas
Add the validation paper, needed measure definitions, scoring guidance, and any supplement you can access. Label the versions and source roles clearly. Use only material you have permission to upload. A research-paper summary can help keep the reported finding and its limits together.
- Select the needed papers and definitions with
@mentions. - Ask for each pair of target and comparison scales, concept definition, score direction, predicted link, result in the paper, and study limit, with passages for every row.
- Open each citation and read the context. Check the exact subscale, scoring direction, sample, and whether the number belongs to that pair.
- Correct claims that confuse a related concept with the same concept or turn a link in the paper into full validation.
- Mark missing reason, uncertainty, or method detail as not located in the supplied sources. Do not let a draft fill the gap with a plausible statistic.
- Choose New → Note, save the reviewed evidence table and open questions, and confirm Saved.
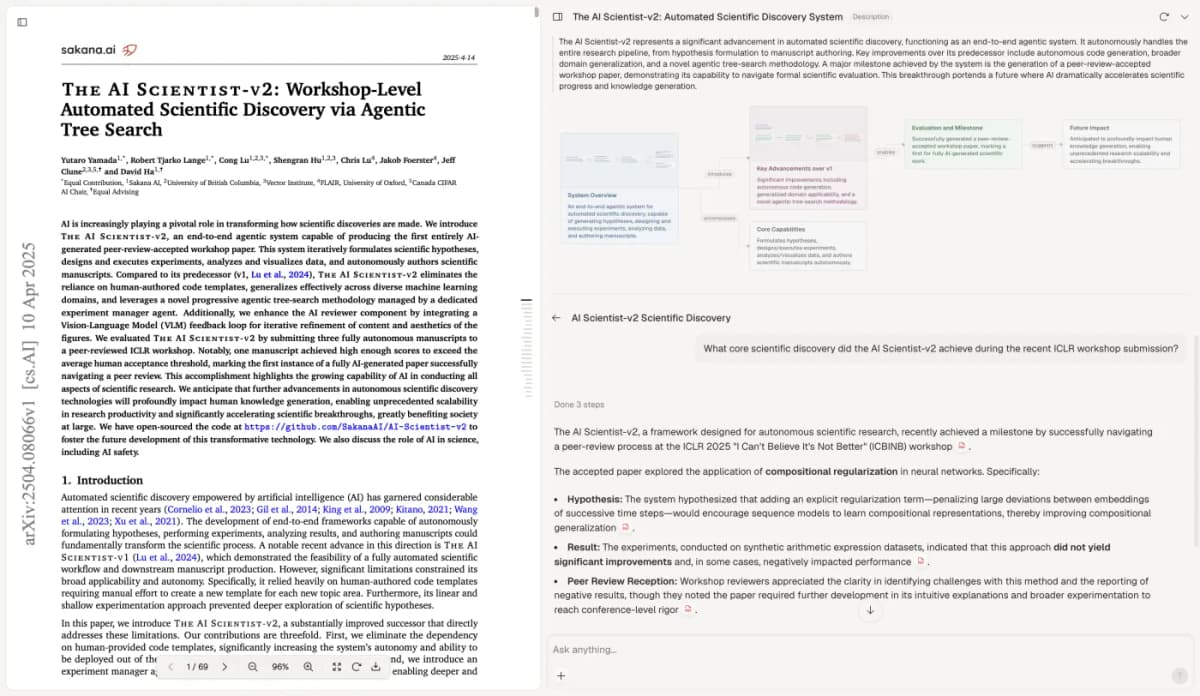
Actual Atlas citation-checking view using an AI Scientist paper. It shows source inspection, not the fictional scales or a completed validity assessment.
The visible paper is The AI Scientist-v2 by Yutaro Yamada and colleagues, 2025, under CC BY 4.0. The existing screenshot is reused unchanged.
Ask: “Using these papers and definitions, compare the target and related scales. Cite score directions, links that theory predicts, and findings in the paper. Separate the authors' claims from missing details and my review judgments.” The resulting draft still needs a human source check.
If a citation supports the scale's definition but not the reported result, split the row and locate the result. A single citation marker should not hide two claims with distinct support. Save the corrected wording and the page or section behind each part.
Save the conclusion and its limits
Save the scale version and the other scale’s name in your note. Keep their definitions, sample, timing, result, uncertainty, and source pages together. Add the review date and unresolved questions so you can update it when another validation paper arrives.
Before you use the claim, check that it states what the study supports in its own context. It should not promise validity for every use. A useful table makes the relationship and its limits easy to inspect without pretending to settle the whole measurement question.
Check the passages behind your validity claim
Compare the measure definitions with the paper's reported evidence.