

Correlational research asks how measured variables vary together. Researchers observe the exposure of interest instead of assigning it. A pattern in a sample can help frame a forecast or a question for further study.
A study may find that students who sleep longer tend to earn higher scores. That finding does not tell you how much a student's grade would change if they were made to sleep an extra hour.
To compare such studies, keep the measures, dates, sample, and reported result beside the claim. The worked table below shows this with two published papers. Atlas can help compare chosen sources; you inspect the passages and save the checked note.

Compare reported associations in Atlas
Trace each study's measures and claims to its cited methods and results.
What correlational research can show
The key is how the study is done: researchers observe the variables rather than set a change in one to test its effect. The BCcampus textbook chapter explains why this work can take place in a lab or daily life, with numbers or categories.
The sign of a correlation tells you which way the values tend to move. With a positive association, higher values of one measure tend to accompany higher values of the other. With a negative one, higher values tend to accompany lower values. Neither sign means the result is good or bad.
Strength tells you how closely the values follow the pattern that the coefficient describes. Akoglu's guide shows that fields use labels such as weak and strong in different ways. Keep the value and what it means, with a reason for any label you use.
A descriptive research aim characterizes a phenomenon, while an association question asks how measured features relate. A project may do both, but a chart of average sleep alone does not answer how sleep relates to grades.
Read the design before the result
Identify the question and unit
Start with who or what contributes a pair of measurements. Is it one student, one school, one country, or one day within a student? A link between country averages does not automatically describe the link among people within each country.
Use the study's research objectives to find the question it aims to answer. Then look in the methods for what was measured, where, and when. Calling a score a predictor tells you its role in the model. The label alone does not show that it causes the outcome.
Check how people entered the study
Read recruitment, exclusions, completion, and missing records before describing the sample as representative.
In Okano and colleagues' study, volunteers came from one chemistry course and 88 completed the study. Its scope should stay with that sample and setting.
A larger dataset can reduce some uncertainty while still selecting a narrow group. Ask who could not enter, whose records were dropped, and whether those choices might be related to both measures. Keep the answer or the reporting gap with the finding.
Preserve the time window
A one-time survey and records across several dates answer different questions. Check when each score was taken and how the authors found its average. Keep track of whether the outcome came before or after the period used to measure the exposure.
The Creswell paper links earlier-term sleep with later GPA. That shows which record came first, but it cannot rule out shared causes that existed before both.
Inspect the measures and association evidence
Define what each score means
Write the unit and construction of both measures. Hours slept, minutes in bed, a device quality score, and a self-report of restedness are distinct variables even when a title refers broadly to sleep.
Okano's methods explain which quizzes and midterms make up the course score. The paper also warns that its device's sleep-quality score lacks a published basis for validity. A device can record one feature well while the meaning of another score remains unclear.
Read the coefficient's job
Pearson's correlation, usually written as r, sums up how closely two sets of numeric values follow a straight-line pattern. Spearman's rank correlation asks how the ranks tend to move together or in opposite ways. Keep the name with the value so readers know which question it answers.
Before relying on a straight-line score, read the plot. NIST's scatter-plot guide shows how curves, changes in spread, and outlying points can reveal patterns that one value misses. A Pearson value near zero can still occur with a curved link in the data.
Retain precision and model status
Keep the estimate, sample size, confidence interval where reported, and any p-value used. An interval helps show which values remain compatible with the model and data. If your checked passage lacks an interval, mark that gap instead of inventing one.
A regression slope and a correlation coefficient are not interchangeable. For an adjusted model, record the included variables and their units. Creswell's Table 2 reports models with and without previous-term GPA; a reader needs that distinction to understand each row.
A worked sleep-and-grade study comparison
The five rows below are reading notes from two original papers. No coefficients were calculated for this guide. The first three rows come from the 2019 course study; the last two come from the 2023 prospective paper. These are selected findings, so the table is not a full literature review.
Five findings from two papers, with the scores, dates, results, and limits kept together.
| Original source and finding | Measure and reported result | Interpretation retained in the note |
|---|---|---|
| Okano 2019, Results: duration | Semester mean sleep duration and overall course score; Pearson r = 0.38, p < 0.0005 | Positive linear association in the completed course sample |
| Okano 2019, Results: inconsistency | Standard deviation of daily sleep duration and course score; r = −0.36, p < 0.001 | Greater variation in duration accompanied lower scores; this is not bedtime variation |
| Okano 2019, timing results: previous night | No statistically significant correlations for reported sleep-duration or quality tests before assessments | Preserve the tested window and uncertainty; do not conclude that sleep has no relevance |
| Creswell 2023, Results and Table 2: pooled confirmatory samples | Earlier-term sleep related to later GPA after previous-term GPA adjustment; reported association equivalent to 0.07 GPA points per hour | Adjusted prospective association, not a demonstrated effect of adding an hour |
| Creswell 2023, Table 2: Study 5 | Adjusted sleep coefficient in the same direction but nonsignificant, p = 0.34 | Keep this individual result beside the pooled result; do not call every sample significant |
Table 1: The course paper's outcome is not institutional GPA. It sums eight quizzes and three midterms, leaving out the final and last quiz for a stated motivation concern. That outcome choice matters when you compare it with the later paper's GPA measure.
The original figure below shows overall score on both horizontal axes. Panel A plots mean sleep duration and an upward fitted line, with r = 0.38. Panel B plots variation in duration and a downward line, with r = −0.36. Points remain scattered around both lines, showing variation among students.
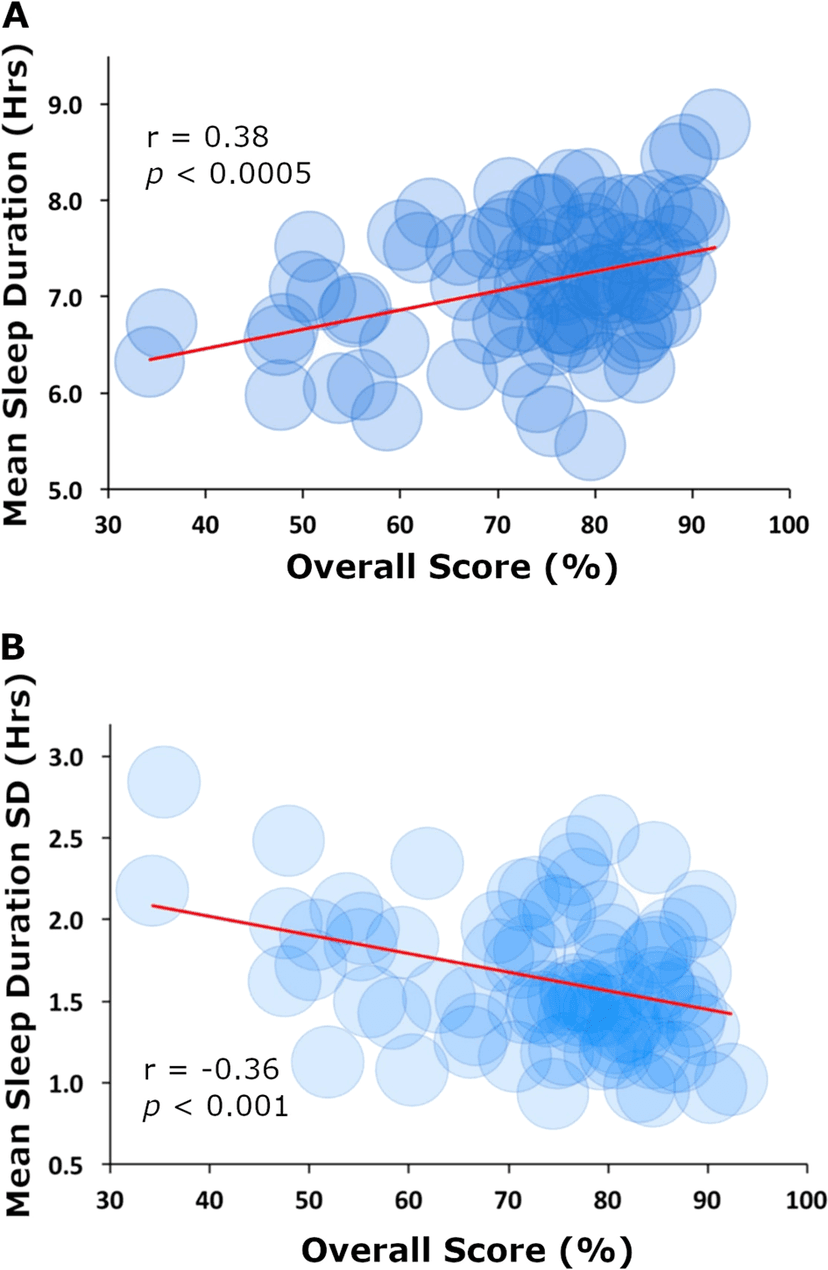
Original Figure 1 from Okano, Kaczmarzyk, Dave, Gabrieli and Grossman (2019). Full image reproduced unchanged under CC BY 4.0.
Both associations are visible in the figure and reported in the table as text. The plotted line does not show a controlled change in sleep or a guaranteed score for a student. It summarizes the observed sample under the paper's measures.
Read the paper's Results and Discussion for the wider pattern and limits. Keep the night-before tests and Study 5 result in view. A broad “more sleep means better grades” note could hide them.
Check the leap from association to cause
Consider a shared cause
A third feature could affect both variables. As a teaching hypothesis, workload might affect sleep and time spent on coursework. This gives you a possible shared cause to check. We have not shown that it explains either paper's results.
The BCcampus account explains both shared causes and the chance that the causal direction runs the other way. Ask which of these possibilities the study checked. An account that sounds right still needs evidence before you treat it as confirmed.
Check what adjustment addresses
A model can ask about the link between two variables while holding measured features fixed. Read why the authors chose those features and how they measured them. Adding more names to that list does not show that all shared causes have been ruled out.
In the prospective study, the authors observed sleep and grades. Its discussion calls for trials that would change sleep to assess a causal role. Keep that difference clear when the paper says predicts.
Rewrite the claim at the right level
An unsupported draft might say: “Giving students one more hour of sleep raises their GPA by 0.07.” That turns an observed between-student association into a promise about a change imposed on a student.
A checked version would say: “The paper linked earlier-term sleep with later GPA in its pooled confirmatory samples, in a model that included prior GPA. It did not test what happens to grades when students are assigned an extra hour.” This preserves the finding and the question a trial would need to answer.
Compare like findings across studies
Keep the outcome and window together
Do not put a semester course score, a single test, and end-of-term GPA into one column labeled performance without retaining their definitions. The findings can speak to a broad topic while still answering distinct questions.
Hours slept and how much those hours vary are distinct features. A paper about changes in bedtime is studying something else again. When titles look alike, check the methods through the source synthesis workflow, keeping each claim tied to its paper.
Distinguish levels and models
The figure compares students' average measures. It does not show that an individual earns a higher mark on each day they sleep longer. Between-person and within-person questions need data and analyses suited to their own units.
Keep each type of model and sample in its own row. A plain correlation and an adjusted regression answer different questions, as do one sample and a pool of samples.
This guide reads the findings side by side, without pooling them statistically or conducting a meta-analysis. Such work would need a justified plan for the estimates and differences.
Record a meaningful disagreement
When findings differ, check the score, sample, dates, and model before calling one a failed replication. Asking about the night before a test is distinct from asking about a month's average. Both results can be correctly reported.
If the differences still leave a real conflict, name it and retain both passages. State what additional detail would clarify the conflict. Do not erase an individual nonsignificant result simply to make a pooled finding sound uniform.
Check whether the source pairs the same person’s two scores. In a made-up review task, a sleep value from one student and a grade from another would be a matching error. Even if each value were recorded correctly, that pair would not answer the study’s question about students.
Keep the source date with each row when a score or device changes across papers. A shared brand name is not enough to show that two scores use the same rules. If you cannot find those rules, mark the gap and describe the comparison at that level.
Preserve uncertainty and missing information
Nonsignificant is not proven absent
A p-value above a chosen threshold does not prove that the true link is exactly zero. Read the value and interval, where provided, to see what range remains uncertain. Keep the result within the claim its data support.
Study 5 did not pass the paper's threshold for statistical significance. Keeping its row in the table lets you see the gap between a result's direction and a firm claim about the wider group.
A plot does not repair sampling
Look for influential points and restricted ranges, using the NIST plot questions. Ask whether a few points or a narrow group shape the result. Keep source-reported checks separate from concerns you raise yourself.
A clear plot and a small p-value still do not establish who the sample represents. Neither tells you whether missing records are harmless. Read selection and missing-data handling before carrying a finding to another course or population.
Suppose, as a made-up case, the students who stop wearing a device also miss more tests. Dropping them could change which pairs remain in the study. You would need the real missing-data records to assess that concern; the case gives you a question to ask, not a finding to add to the paper.
Keep the full result set in view
A paper may test several sleep features across several assessments. Check which tests were planned and how multiple testing was handled.
Check which results the summary omits too, because a single appealing association can give a false impression of the wider result set.
Okano's timing results explain how the authors dealt with several tests. Read those rules alongside the score cautions. One small p-value should not become your only basis for describing the paper.
Review reported associations in Atlas
Add the papers you are allowed to use and wait for processing. Use @ mentions in Chat to select the study sources. Project only keeps new retrieval in the project, while earlier chat context remains available; name the papers when your comparison needs a clear boundary.
Ask for a source-linked table
Ask: “Compare the links reported in these studies. Give each sample, pair of scores, dates, model type and result location, with the limits on causal claims. Keep one-study findings apart from pooled findings, and mark missing details.”
Treat the answer as a draft reading aid. Check that the table includes the nonsignificant result and that a regression coefficient has not been mislabeled as a correlation.
Trace and correct the claim
Open citations beside each key result and read the methods or table notes as well as the result sentence. Verify the variable units, adjustment and sample.
If a citation lacks a precise location, mention the source and ask for the relevant section, then locate it directly if needed.
If the answer says an extra hour caused a grade increase, ask it to separate the reported association from an assigned intervention. Check the correction against the paper's discussion before using it elsewhere.
Save the reviewed comparison
Use New, then Note to retain the checked table with its source set, selection limits, model details and unresolved causal questions. Confirm Saved after editing, and include links or source mentions that let you return to the papers.
If a source or caveat was missed, mention the omitted paper and request a focused follow-up. Keep the gap in the note until you have checked it. Saving the comparison preserves your reading work; it does not perform the statistical analysis.
Write a bounded association note
Conclude with the pattern your chosen studies support, the differences that prevent a single simple claim, and the design limits. Keep the wording about the studied samples rather than make a prediction for every student.
For this example, the note would keep the sleep dates and grade scores beside each finding. It would show the pooled adjusted result and the Study 5 caveat, leaving open what would happen if a trial assigned more sleep.
Give the next check a target, such as locating an interval or reading the reason for a particular exclusion. A precise follow-up lets another reader see what remains to be learned before the claim can be widened.
Compare reported associations in Atlas
Trace each study's measures and claims to its cited methods and results.