

The main difference in case control vs cross sectional studies is how people enter. A case-control study chooses people with the outcome and a suitable control group, then checks exposures. A cross-sectional study takes a sample and assesses people within a set window.
Dates alone do not settle the design. Nor does seeing an odds ratio in a results table. Read the entry rule, the time each measure refers to and whom the claim covers.
Two real reports show how to make those checks. Atlas can help read your papers side by side with citations. You inspect the source text and decide what the design supports.

Check sampling and timing in your papers
Compare entry rules, time windows and claims with source passages.
Case control vs cross sectional differences
A case-control study starts from the outcome under study. Cases meet its definition; controls do not. The researcher checks what each group was exposed to. A control can have the exposure being tested. That is part of the design, rather than a flaw in it.
In a cross-sectional study, people enter through a rule for sampling the group of interest. The study assesses exposure and outcome within its window. Some people may have the outcome and some may not. Those groups did not decide entry as cases and controls would.
The CDC study-design lesson explains this distinction. When a paper's title and methods seem to conflict, keep its actual entry rule in your note. Do not settle the conflict by choosing the more familiar label.
Both designs can examine links between measures. Neither name, by itself, tells you whether a link is causal. Check what the authors measured, which groups they compared and what limits remain.
Read how people enter the study
Trace the case and control rules
Find the case definition before reading the exposure result. It may require a diagnosis, a test result, symptoms or a set date range. A vague note such as “people who were ill” loses details that govern who counted.
Next, locate how controls were found. Were they drawn from the same place or setting as the cases? Could they have become cases under the study's rules? These questions matter more than whether the control group sounds healthy.
The CDC control-selection guidance says controls should reflect the source population. Their entry should not depend on the exposure being tested. Choosing only unexposed people can skew the contrast from the start.
For a fuller reading workflow, the case-control study guide covers case definitions and control selection. Here, keep those rules beside the cross-sectional entry rule. You can then see how each sample serves its study's question.
Trace the population sample
For a cross-sectional paper, find whom the study aims to cover and the list or frame used to reach them. Who could enter? Who was left out? A national household survey and a single-clinic sample do not describe the same group, even with the same design label.
Setia's methods guide explains how entry rules affect whom a cross-sectional sample covers. Record who could enter and who was reached. A clinic finding needs further support before you apply it to all residents.
Separate study time from record dates
Map what each date means
A paper may give dates for fieldwork, exposure and the outcome. Each answers a distinct question. “Data collected in March” does not tell you when an exposure happened or whether it came before the outcome.
Case-control studies often ask about past exposure. Some use records gathered earlier within a cohort. Read how the records were made and how the cases and controls were chosen. The analytical-designs review explains these choices.
The word retrospective also appears in cohort research. It cannot tell you the design on its own. Find the entry rule before labeling a paper that uses old records.
Keep the participant window separate
Cross-sectional fieldwork need not happen on one day. A survey may visit people over months or years while assessing each person within one study window. That span does not, by itself, mean that each person was followed through time.
Repeated surveys can also take a new sample at each wave. That differs from tracking the same people. The cross-sectional research design guide covers these timing choices in more depth.
Check the source of each measure too. A current outcome and a recalled past exposure do not both describe the present. A history may help show which came first. It still leaves questions about who entered, what they recalled and other possible causes.
Compare 2 real methods sections
Locate each sampling rule
The 2007 CDC outbreak report describes a February case-control study with 65 case-patients and 124 well adult controls. The controls came from matched communities. These are original report details, rather than a generic textbook example.
The NCHS NHANES report describes a cross-sectional survey and its combined 2017–March 2020 data files. Use the rows to compare methods, rather than unrelated health findings. Check each source location and keep the missing detail visible before drawing a design conclusion.
| Reading check | February CDC study | NHANES report | What the note should retain |
|---|---|---|---|
| Entry rule | Outbreak cases and well adult controls; February study paragraph | Population sample; page 2, About NHANES | Outcome-based groups versus population sampling |
| Exposure groups | Both groups could report peanut butter consumption; results paragraph | Measures collected within the survey; page 2 | Controls do not mean unexposed people |
| Time window | February substudy's exposure anchor is not stated in that paragraph | Combined 2017–March 2020 collection; pages 2–3 | A missing anchor differs from a known fieldwork span |
| Population claim | Selected case fraction is not population prevalence | National estimates require the described weights; pages 2–4 | Check the denominator and sampling design |
Table 1: The reports answer different health questions. This table compares how their samples and dates support different kinds of claims.
When you read a study report beside a methods review, check primary versus secondary source roles. Record which passages report the original study and which explain other work. That distinction describes their use; it does not establish their quality.
Preserve the missing exposure anchor
The CDC report also describes an earlier January survey. Its stated exposure window belongs to that survey. Do not move it into the February study. Mark the February anchor as missing from the paragraph you checked. Seek that study's protocol if the detail matters.
This is a useful correction to a neat design table: “looked back” is too vague when the exact dates are missing. Keep the gap in the note. A nearby account of a separate procedure cannot fill it.
Check the population and denominator
The share of cases in a chosen case-control sample does not tell you how common the outcome is among all people at risk. Researchers choose how many controls to sample. Adding controls changes that share, even if the outcome is no more or less common.
For a cross-sectional result, ask whom the sample can speak for. The NCHS methods name that group before describing how people were chosen.
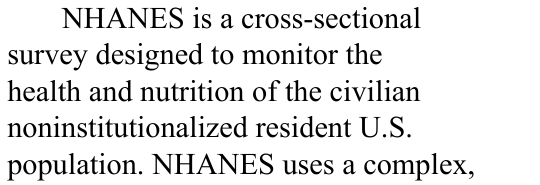
NCHS report 158, page 2, names whom NHANES aims to cover. This passage does not say that every sample can speak for that group.
The incomplete 2019–March 2020 cycle could not support national results on its own. The report explains how data were combined and given special weights. A label such as “national survey” cannot replace checking which files and weights were used.
More generally, cross-sectional prevalence tells you how common an outcome is within a set group and time. It does not directly count new cases as people are followed. Keep those meanings separate when reading the numbers.
Read the estimate in context
Choose a sampling-first reading when a design label is unclear. Check who entered and why before using a statistic to name the study. Then read that statistic within the rules the authors used.
Do not classify by the statistic
An odds ratio can appear in either design. Setia's methods discussion describes its use with cross-sectional data. That number does not prove that the sample was chosen as cases and controls.
Nor should you rewrite an odds ratio as “times the risk” without checking what it means and when that reading holds. The CDC analysis chapter explains why a measure needs its study context.
Keep the outcome rule, reference group and uncertainty beside the result. Note whether the analysis used matching or survey weights. Without these details, a bare number may seem to answer a question the authors did not ask.
Keep causal limits beside the result
A cross-sectional link can leave direction unclear. People may change what they do after an outcome develops. Their current behavior may thus follow the outcome, rather than cause it. Setia's examples explain this concern.
In case-control reading, check recall, records and the control group. The analytical-designs review explains how these can shape the result. Knowing an exposure came first helps answer one question. It does not rule out all sources of bias.
Other factors may also explain the link. The confounding variable guide shows how to examine a possible third factor. Record what the authors adjusted for and what limits they kept. A model does not prove that every other cause has been ruled out.
Compare selected papers in Atlas
Use papers and methods guidance that you may lawfully supply. In Atlas, choose Add a source, then Upload files for permitted PDFs. Wait for processing and check that you can read the methods text before asking about it.
In Ask a question, select the sources with mentions. Ask how people entered, what each date means and whom the sample covers. Include the results and gaps. Request a citation for each row and ask Atlas to keep missing facts marked as missing.
Open the numbered citations and read the nearby methods text. Check the entry rule rather than relying on a label in the abstract. If a citation does not land at the exact passage, find it in the source and record the page or section yourself.
A checked note can say: “The CDC study compares exposures between chosen cases and controls. NHANES uses a survey sample and weights to estimate outcomes in the population. The checked February paragraph does not state the exposure anchor. These methods alone do not prove a causal effect.”
Create a New Note, add the corrected claim and source locations, and confirm Saved. Atlas helps keep the evidence together. You own the design judgment and any further work on statistics or cause.
Save a bounded design note
For these reports, reject a draft claim such as “Both studies show disease risk for all people and what caused it.” The case fraction cannot give prevalence. The NHANES result depends on its sample and weights. Neither design name proves cause.
Keep who entered, when they were assessed and whom the claim covers in one note. Add the source version and where you checked each gap. Later, you can retrace those facts instead of relying on a remembered label.
Use the research notes workflow to keep this note alongside the papers. If a protocol gives the missing exposure anchor, revise that field and its source location. A guess cannot replace the gap.
The finished note should let a reader tell the two samples apart and retrace your reasoning. It should also show where the evidence stops, especially when you move from a link between measures to a claim about cause.
Check sampling and timing in your papers
Compare entry rules, time windows and claims with source passages.