

Longitudinal research design is a plan to observe change over time through repeated data collection. The key choice is what repeats: the same people, the same organizations, or a sample from the same population. Caruana and colleagues explain these different forms and their demands.
A useful plan names the waves, why they are spaced that way, and what happens when data are missing. This guide works through a fictional graduate cohort and shows how to compare the methods behind a follow-up plan.

Compare follow-up plans in Atlas
Check the methods passages behind your schedule and retention assumptions.
What makes a design longitudinal
A wave is one planned round of observation. In a panel, you link records for the same people across waves so that you can study how each person changes. A new sample at each wave can show population trends, but it cannot reveal each person's path.
A cohort is a group defined by a shared feature, such as entering university in the same year. You can follow that group over time. The BLS survey design shows a real example of a cohort defined at the start and followed through later rounds.
Longitudinal describes the time structure. It does not by itself tell you whether researchers assign an intervention, observe events, or use past records. The scholarly methods overview includes both observational and experimental forms.
Define the link between waves before you claim to measure change. Without a stable person or case identifier, a difference in the average may reflect who entered the sample rather than how the original people changed.
Choose the change you will study
Choose a schedule around the change your question asks about: confidence after graduation, the timing of entry into work, or a difference in change between groups. Each requires records that capture the relevant process.
Turn that question into research objectives that name the period and outcome. "Study graduates" is too broad to explain why you need four waves. "Describe how confidence changes from before graduation to the following year" gives timing a purpose.
Define the unit of analysis too. A person may complete four surveys, but those are four linked records from one person. The data do not contain four independent people merely because four rows exist.
Prospective work gathers data as the study unfolds. Retrospective work draws on records of events that have already happened. Caruana's design discussion explains both routes. Existing records can save time, but you inherit their measures, gaps, and date quality.
Check what the evidence can show before settling on the label. A record with only graduation and current status may show two endpoints. It may tell you little about a short period of unemployment between them.
Match waves to expected change
Space waves around the process you want to observe. A survey every year may miss a transition that takes a few weeks. Very frequent contact may add burden without adding useful evidence. Explain the tradeoff for your specific question.
Two waves can show a start-to-end difference while leaving the path between those points unknown. To distinguish an early jump from a slow rise, plan observations along that path.
The original figure below contrasts a steady group difference with a gap that grows over time. Its top panels share measurement times across people, while the lower panels allow starting times to vary.
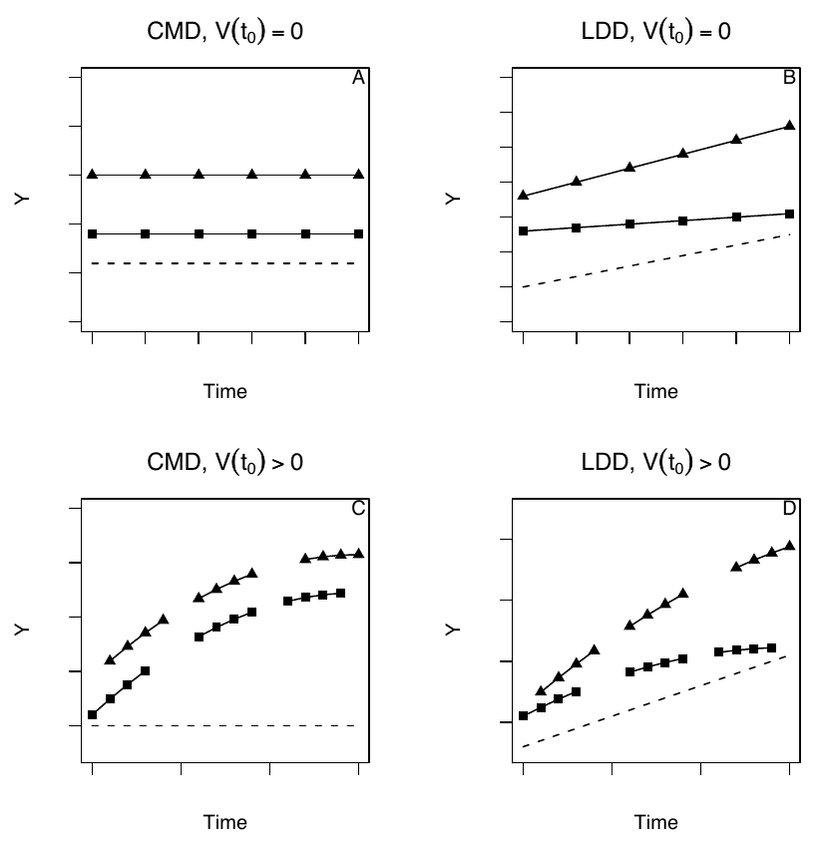
Basagaña and Spiegelman's The Design of Observational Longitudinal Studies, Figure 1 supplies these plot panels, exported from the original PDF under CC BY 4.0. Squares and triangles mark two groups, while dashed lines show their difference. These are possible response patterns under the paper's assumptions, rather than real study results.
The figure helps you name the change you seek. The original paper uses an outcome on a scale, two fixed exposure groups, and a defined link between records. Check that your study fits those assumptions before using its formulas. Other outcomes or exposures need their own plan.
Keep actual dates as well as planned waves. A "three-month" response collected late may concern a different stage of the process. Decide how such timing will be recorded and reviewed before the study starts.
A worked follow-up schedule
Suppose a fictional team wants to describe confidence and work status in the year after graduation. It plans to follow students from one class. All dates and counts in this example are made up for planning.
The team wants an account of individual change. It therefore plans to invite the same people each time and use a secure link across their records. It still needs consent approval, a tested measure, and a statistical review.
| Wave | Proposed timing | What it adds | Planning issue |
|---|---|---|---|
| Baseline | Four weeks before graduation | Confidence and expectations before the transition | Separate final-course pressure from later work experience |
| Early follow-up | Three months after graduation | Early work status and initial changes | Record late replies and short job spells |
| Midyear | Six months after graduation | Whether an early change persists or reverses | Keep the core measure comparable |
| Final follow-up | Twelve months after graduation | Change across the first year | Review seasonal context and missing waves |
Table 1: This schedule fits one question about a first-year transition. It may fail a question about weekly job-search setbacks. The team should revise the timepoints if the process of interest is faster than the proposed intervals.
Keep a core set of items stable so that scores mean the same thing across waves. If wording or survey mode changes, document the change and assess its impact. The methods editorial stresses consistent recording and linkage over time.
The team also needs a practical contact plan. Name who will send reminders, how participants can withdraw, and how contact details will be kept apart from research records. Respect a withdrawal decision even when retaining more people would improve the dataset.
Published cohorts can show how to report follow-up. BLS gives two rates and names the group used to calculate each one. This small fictional project needs its own basis for a target, given its scope and resources.
Review attrition and missing-data assumptions
Attrition means losing people from follow-up. Someone may also skip an item or miss a wave and reply later. Keep these cases separate so you can explain what is missing and why.
Suppose 120 people join and 96 reply at the final wave. In this made-up example, 80% of the starting group replied. That count cannot show whether their answers fairly reflect the people who left.
The table lists questions the fictional team must resolve before interpreting its final-wave results. Each row concerns an assumption or reporting choice, rather than a recommended statistical remedy.
| Issue | Assumption to check | Evidence or decision needed |
|---|---|---|
| Retention denominator | The count refers to the original enrolled sample | Record the baseline count and define exclusions clearly |
| One missed wave | A person who misses midyear has left for good | Keep later replies linked and distinguish missed rounds from withdrawal |
| Reasons for leaving | Loss is unrelated to confidence or work status | Review available reasons and baseline differences without treating them as proof |
| Missing outcomes | Observed people stand in for those whose outcome is unknown | Seek statistical review of the missing-data assumptions |
| Sensitivity to assumptions | One adjusted estimate settles the issue | Plan justified alternative assumptions and explain what would change the conclusion |
Table 2: BLS defines retention as replies relative to the starting sample. Its response rate uses members who are still alive. Name the base of your own rate so readers can tell who was counted.
Bias depends on who is missing and how that relates to the question. Keyes and colleagues studied loss to follow-up across 30 cohorts. They checked how results would change under different views of the missing outcomes.
Their work supports a careful review of bias. A low dropout rate alone cannot tell you whether loss has changed the answer to your question.
In the graduate example, people who feel least confident might be less willing to reply. The team has not observed that link. Check what is known about those who reply and those who do not, and state what remains unknown.
Records from the same person are linked. The analysis must account for that link, actual times, and gaps. The methods overview explains why treating every record as a separate person can mislead.
Ask a methods expert which model fits the question. Check what that model assumes about missing data and whether those assumptions make sense here.
An event coming first does not prove it caused a later change. Work status may change alongside health, money, and other factors. Use the guide to confounding variables to frame that concern and check what a causal claim would need.
Compare longitudinal sources in Atlas
Use Atlas to read published plans beside your question note. Upload only material you have permission to use. Keep participant contact records and sensitive raw data in the study's approved systems.
- Add selected methods papers, cohort reports, and a note stating your question and known constraints. Wait for sources to finish processing.
- Open chat and use Ask a question. Type @ to select the reports and note, then choose Project only to keep new retrieval in supplied project material.
- Ask for a source-by-source comparison of wave timing, who is followed, retention denominator, and missing-data assumptions. Separate reported facts from your proposed plan.
- Select Send and open each numbered citation. Read the relevant methods passage and nearby limits. Exact source locations depend on what the source supports.
- Correct the comparison, then choose New and Note. Save the checked schedule and open assumptions, and confirm Saved.
For the fictional project, a focused prompt could be:
Compare the selected sources with my graduate follow-up note. For each source, show when data were gathered, who was followed, and who was counted in each follow-up rate. Cite the relevant passages. State what it assumes about missing data. Mark facts it does not report and choices my team still needs to make. Leave power and model choices for qualified review.
If an answer treats 80% retention as proof of validity, inspect the cited passage. Revise the note to say what the count shows and what it leaves unknown. Keep that correction beside the source link so it can be checked later.
Atlas supports reading, textual comparison, and saved notes. Researchers still run follow-up, assess power, select models, and review consent and data protection. A source-backed note is one input to those decisions.
Save a plan you can defend
Replace "Four surveys will prove that getting a job improves confidence" with a claim the proposed design can support. For this fictional panel, a more careful planning note would read:
We plan to describe how confidence and work status change for the same graduates across four waves. We will record the actual dates and keep the core questions stable. The waves cover early and later changes in the first year. This plan cannot yet show that getting a job causes a change in confidence. We still need expert review of linked records and missing outcomes.
Keep the wave table, the base of each rate, and open questions together. If your question or access changes, review the dates and claims that depend on it. This helps a supervisor see why you chose the design.
Before inviting people, settle consent, secure record links, contact steps, and methods review. Save a checked plan that states what the design can show and how the team will handle its limits.
Compare follow-up plans in Atlas
Check the methods passages behind your schedule and retention assumptions.