
Confounding Variable: Spot It Before Trusting a Causal Claim
Learn what a confounding variable is with a simple example, then check how published studies report adjustment, limitations, and uncertain causal claims.
- Byline

Summary
A confounder is a third factor linked to both the exposure and the outcome. It can distort the link a study finds.
In each paper, check which factors the authors named, how they handled them, and what limits they still report.
A model with controls does not prove that the exposure caused the outcome or that all bias is gone.
A confounding variable is a third factor that can distort a link seen between an exposure and an outcome. An exposure is the factor a study asks about; an outcome is the result it measures.
A possible confounder is related to the exposure and to the outcome on its own. The CDC Field Epidemiology Manual sets out those two links.
Picture a made-up study in which people who buy more ice cream also report more sunburn. Hot weather may lead to both purchases and time in the sun. The ice-cream link could then reflect weather in part, even if ice cream has no role in sunburn. No real data are claimed in this example.
When a paper says it adjusted for weather or another factor, check the methods and limits before repeating a causal claim. Adjustment can address factors the team measured and modeled.
It cannot prove that every source of bias has gone away. NLM's health-statistics course makes the same distinction between association and causation.
Atlas can help a researcher compare what selected papers report, open their cited methods, and save a checked note. The researcher still judges whether the design supports a causal reading.

Atlas

Check study limitations in Atlas
Compare selected studies, inspect citations, and save checked notes.
What a confounding variable changes
A confounder can make an exposure and outcome appear more closely linked, less closely linked, or linked in the opposite direction. It does not mean the study's finding is false. It means the observed link may combine the exposure's role with that of another factor.
The CDC manual says a candidate third factor should be linked to the outcome apart from the exposure. It should also be linked to the exposure and not be a result of it. Those conditions keep us from calling every extra variable a confounder.
In the ice-cream example, the exposure is buying ice cream and the outcome is sunburn. Hot weather is a plausible common cause. It can affect the chance of buying ice cream and the chance of spending time in strong sun. The example is a teaching device, not evidence about actual buyers.
The question is not whether a paper listed many control variables. It is whether its design and measurements dealt with plausible sources of the link it aims to interpret. The NLM teaching guide notes that a confounder may change the size or direction of an observed association.
See a simple third-factor example
Name the two links
For the weather example, draw three boxes on paper: weather, ice-cream purchases, and sunburn. Draw one arrow from weather to ice-cream purchases and another from weather to sunburn. That is the proposed confounding path.
The boxes help you state an assumption. They do not test it. To study the claim, a researcher would need a clear question, suitable data, and a plan for measuring weather and other likely factors.
The CDC analysis guide places potential confounders in the study plan, before the final result is read.
Ask what the data cannot show
Even if the made-up ice-cream link shrank after a weather adjustment, that change alone would not tell us why. The weather measure might be crude. Time outdoors could matter too. The people who answered might differ from those who did not.
The point is to test a rival account of the link, then report what remains open. A small p value or a line in a regression table cannot settle those questions.
The CDC chapter on interpreting data separates a statistical link from a causal judgment.
Identify plausible confounders before checking results
Start with causes and timing
Start with what is known about the topic, not with a list of variables that happened to be in a data file. Ask whether a factor could precede the exposure, help shape who was exposed, and affect the outcome for another reason. A factor measured only after the exposure needs a closer look.
The observational-study methods paper describes why a pre-exposure view matters. It also notes that design choices and analysis can lessen some confounding while leaving other bias. This is a task for a methods expert when the causal answer matters.
Separate a mediator from a confounder
A mediator lies on a path from exposure to outcome. If exercise affects sleep, and sleep then affects mood, sleep could be a mediator of part of exercise's effect on mood. It has a different role from a prior factor that affects both exercise and mood.
Whether to account for a mediator depends on the exact effect a study wants to estimate. Adding it to a model by default can hide part of the path under study. The methods discussion of observational studies cautions against treating a factor on the causal path as an ordinary confounder.
Watch for a collider
A collider is a factor affected by two other factors. For example, if both a symptom and access to care affect who visits a clinic, studying only clinic visitors can create a misleading link between those causes. The causal-diagram tutorial shows why selecting or adjusting on a shared result can open a false path.
This is a reason to read the sampling and model choices, not a way to diagnose a named paper from one sentence. A methods paper on collider bias explains that restriction, stratification, or adjustment on such a factor can introduce bias. More controls in a model do not always mean less bias.
Read what a study measured and adjusted
Find the proposed factors
In a real paper, begin with the question and study design. Write down the exposure and outcome. Then search the methods for covariates, potential confounders, matching, restriction, or adjustment. Record the author's exact term and where the factor appears.
Next, look at when each factor was measured and how it was coded. A factor can be named but poorly measured. A study can also use a matched design, group results by a factor, or include variables in a statistical model.
For a self-reported factor, inspect the question wording and collection setting too. Social desirability bias can affect what respondents report; it is a response-measurement concern, not automatically a confounder. Keep that issue separate from the factor's proposed causal role.
The CDC manual describes planning those checks and comparing results within groups.
Keep the method and claim apart
Check the results and limits after the methods. Did the authors show an estimate before and after adjustment? Did they say which factors were in the final model? Did they name unmeasured factors or other bias? Report those facts without declaring that the adjustment succeeded.
The NLM course notes that a confounder may strengthen, weaken, or erase a link. A paper's adjusted result therefore needs its own label. It is not a test that all plausible confounders were found.
For a wider way to inspect a paper's question, method, and result, see the research paper analysis guide. This page focuses on the narrower job of tracing possible confounders and the limits of the reported adjustment.
Compare confounder reporting across papers
The table below is hypothetical. A1, A2, and A3 are invented paper IDs. No papers were read for these rows, and the bracketed locators are placeholders for passages a researcher would check in real full texts.
| Paper and question | Factor the authors report | Design or analysis step they report | Passage to check | Author-stated limit | Open question |
|---|---|---|---|---|---|
| A1: Is outdoor time linked to sunburn? | Weather and skin protection | Groups results by weather | [A1, methods and results] | Weather was logged by week | Could daily heat and sun differ within a week? |
| A2: Are ice-cream sales linked to sunburn reports? | Weather | Includes a weather term in a model | [A2, model and limitations] | Time outdoors was not measured | Could time outdoors explain part of the link? |
| A3: Does exercise relate to mood? | Prior health and sleep | Includes both in a model | [A3, timing and model] | Role of sleep is unclear | Was sleep measured before or after exercise? |
Table 1: The third row is deliberately unresolved. If sleep changed because of exercise, it might lie on the path to mood. If prior sleep affected both exercise and mood, it might be a confounder. The short description cannot tell. Keep the row open rather than assigning a role from the variable name.
For real studies, replace each placeholder with a checked passage. Keep what the authors reported apart from your view of what they may have missed.
A paper on observational confounding describes the assumptions behind adjustment. A table of covariate names alone cannot show that those assumptions hold.
The literature review process can help carry such checked notes into a larger synthesis. If you compare methods across studies, the research paper synthesis guide covers that broader task.
Next steps for checking papers in Atlas
Put the selected full texts in one Atlas project. In chat, type @ and choose the papers to compare. Ask: “For each paper, list the exposure, outcome, reported possible confounders, how each was measured or handled, and the author's stated limits. Give a citation for every row. Mark an unclear role as unresolved.”
Open the cited methods and limitations beside each key row. Read the nearby text. If Atlas blends two papers or fills an unstated detail, ask for a source-by-source answer, then correct the table yourself. Save the checked version and its open questions in a note.
Atlas helps compare supplied text and inspect citations. It does not choose a valid set of factors, run a new model, find every unreported cause, or decide whether a causal effect was identified. A qualified researcher must make those judgments.
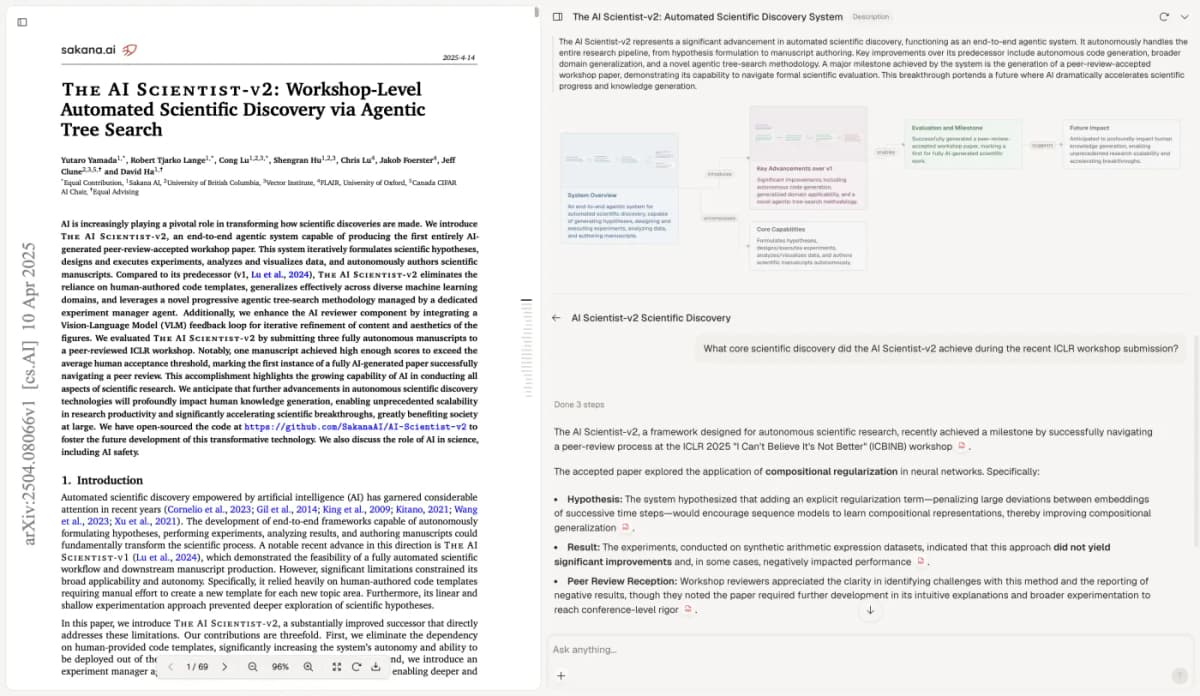
The image shows Atlas with a paper open beside a cited answer. Its visible paper is about AI science, unrelated to the fictional A1–A3 examples. It shows where to inspect a passage while checking a draft.
State what the causal claim cannot establish
An adjusted association is still an association unless the design, data, and assumptions support a causal reading. The CDC manual warns against using statistical significance alone as proof of cause.
The NLM guide makes the same point in plain terms.
In the fictional A2 example, “Ice-cream sales caused sunburn” reaches beyond the imagined report. A source-faithful note would say: A2 reported a link between sales and sunburn reports after its stated weather adjustment. It did not measure time outdoors, so another explanation remains possible.
That revision says what the study reported and what it left open. It does not claim the adjusted model found the true effect. Residual confounding means some distortion may remain after the controls used, perhaps because a factor was missed or measured poorly. Other bias can remain too.
When the question concerns how a result arose within one case, process tracing offers a different check: specify a proposed causal sequence, seek evidence for each step, and test rival explanations. It does not turn an adjusted association into causal proof.
When reporting several studies, name which factors each paper assessed and what its authors could still not rule out. If a factor might be a mediator or collider, do not present its presence in a model as automatic progress.
Leave the causal verdict to an expert who can review the full design. Once that within-study claim is clear, the external validity guide shows how to test whether it may inform a different population or setting.
Atlas
Check study limitations in Atlas
Compare selected studies, inspect citations, and save checked notes.
Frequently Asked Questions
It is a third factor related to the exposure and independently related to the outcome that can distort their observed association.