
Social Desirability Bias: Examples and How to Assess It
Learn what social desirability bias means, see survey and interview examples, reduce the risk, and assess a study's claims without assuming anyone lied.
- Byline

Summary
Social desirability bias can lead people to give answers they think others will approve, especially on sensitive topics.
Plain questions and private ways to answer may help. No survey design makes every answer free of bias.
Keep a risk of bias apart from a measured gap between answers. Neither shows a person's true view on its own.
Social desirability bias can arise when a person gives an answer they think will look acceptable. In a survey or interview, that could mean reporting more of a valued behavior or less of one seen as shameful. The answer alone cannot tell us whether this happened.
Imagine a fictional campus survey that asks, “Do you always follow the recommended study plan?” A student may say yes because the question sounds like a test of diligence. The same yes could also be true. A researcher needs the question, the setting, and other evidence before making a claim about bias.
Atlas can help compare the wording and conditions in study reports you choose. Open the cited passages and save a note that separates what the paper reports from what you suspect. Atlas cannot detect a lie or recover a person's true answer.

Atlas

Check study context in Atlas
Compare source passages, inspect citations, and save a qualified note.
The answer and its limit
It is a risk in self-report data: people may answer in a way they believe others will approve. The pressure can be stronger for questions about conduct, status, or views that carry a social cost. A person may wish to make a good impression without intending to deceive.
Two terms can help frame this risk. Impression management means trying to look good to others. Self-deceptive enhancement means believing a flattering view of oneself. Paulhus and colleagues studied both in a job-applicant setting. Neither label tells us one person's motive from one answer.
Pew's survey guide says an interviewer's presence can raise this risk for some questions. Yet an online answer is not always true. The words, setting, memory, and mix of people who respond can also shape the result.
Survey and interview examples
In the fictional study-plan question, “always” leaves no room for a mixed week. A student may choose yes to look diligent, reject the question as unfair, or read “recommended” differently from the researcher. Each path can change the answer.
Consider a second, fictional interview. A staff member says a new policy is “working well” while their manager is in the room. That setting gives a reason to ask whether the answer was shaped by social pressure. It is not proof that the staff member thinks otherwise.
The survey wording suggests a “good” answer. The manager's presence may affect how safe criticism feels. A phone-versus-web gap can show that responses changed with mode, but it cannot name the cause by itself.
Pew's phone-versus-web experiment found mode differences on some items, including sensitive ones. Its result is evidence about those tested questions and modes. It is not a correction factor for every survey.
Separate social desirability from other response effects
A positive answer may reflect a sincere belief or a remembered event. It may also reflect a question that leads the person, a vague time frame, or a wish to agree with the interviewer. Call social desirability a possible influence until the study supplies evidence that supports a narrower claim.
Other effects can resemble it. A respondent may forget a past action. Two people may read “often” differently. A web survey may reach a different group from a phone survey. A mode gap does not identify which of these caused it.
If a study uses those answers to assess an exposure–outcome association, review its confounding-variable analysis separately. A distorted self-report can weaken measurement, while a confounder is a factor with a proposed causal relationship to both exposure and outcome; one label does not establish the other.
| Possible effect | What to inspect | What remains unknown |
|---|---|---|
| Social approval pressure | Topic, wording, who heard the answer | Whether a given person changed their answer |
| Recall error | Time frame and memory demands | What happened unless a valid record exists |
| Agreement with the question | Leading phrasing and answer options | Whether the person truly agrees |
| Survey mode and sample mix | Who answered by each mode | Whether mode or group differences drove a gap |
Table 1: The Pew mode study is useful here because it compared the same panel under two ways of asking. Even in that design, the researchers had to interpret item-level patterns and limits. A single interview quote gives less basis for a cause claim.
The exit interview guide shows a related risk. A worker's answer may be shaped by the setting or a future tie to the employer. Keep that context visible; a kind answer is not proof of a false one.
When is the risk greater?
Ask what a person might gain or lose by giving one answer. Risk may rise on a shamed topic or when a powerful person hears the reply. Unclear privacy and loaded words can add pressure.
Check the actual method. Was the survey anonymous, confidential, or neither? Could a manager see an employee's response? Was the question read aloud? Did the study describe the interviewer's training? Those are source-specific facts, not guesses about participants.
Pew's question-writing guide advises careful wording and testing. A neutral question can reduce one source of pressure. It cannot remove the social norms around a topic.
Nor can a researcher infer risk from a smile or nervous gesture. Such behavior has many explanations. The data claim should stay tied to documented wording, setting, and response patterns.
How can a study reduce the risk?
Write questions that do not praise one answer. Offer clear response choices and a time frame. Test whether people understand the words as intended. Explain privacy accurately and protect responses according to the study's design.
For a sensitive topic, a self-completed survey may reduce pressure from an interviewer. It also brings tradeoffs: people may misread a question, skip it, or be left out if the mode is hard to access. Pew's mode comparison shows why a change in mode needs its own evaluation.
In an interview, a trained interviewer can use neutral prompts and make room for mixed or critical accounts. The team can separate supervisors from data collection when the setting makes that sensible. It still cannot promise that a participant will feel no pressure.
Some designs use indirect questions or social-desirability scales. These can add clues at group level if used and interpreted well. They do not reveal a person's true answer, and they do not fix weak wording or a poor sample. Plan the tradeoffs before data collection instead of “correcting” a result after it surprises the team.
Assess evidence before alleging bias
Read the methods and the exact question before judging a finding. The table below shows how to keep facts, possible effects, and unknowns apart. It is a fictional assessment, not a result from real participants.
| Documented context | Plausible influence | Observed evidence | Other explanation | Warranted conclusion |
|---|---|---|---|---|
| Study-plan question uses “always” and is read by a tutor. | A student may want to seem diligent. | The method lists the wording and interviewer; no independent behavior check is reported. | A yes may be true; “plan” may mean different things. | Flag social pressure as a risk. Do not mark any answer false. |
| A web version uses “In the past week, on how many days did you follow the plan?” | Privacy and a time frame may change the answer. | The study reports a mode gap but no validation measure. | Wording, access, or sample mix may cause the gap. | Report the gap and limits. Do not assign it to bias alone. |
Table 2: The matrix keeps a key line clear: a reason bias might occur is not proof that an answer changed. If the study did not check behavior in another way, the true rate is unknown. Do not quietly lower a positive answer.
The negative case analysis guide shows how to test a working explanation against material that does not fit. When assessing several papers, keep each paper's wording and mode in its own row before comparing them.
Next step: compare sources in Atlas
Add only reports, question forms, or transcripts your project may use. Mention the files with @. Ask for one row per source: the question, mode, privacy promise, steps to ease pressure, answer gaps, and missing facts.
Open each cited passage. If a paper reports an answer gap by mode but no check of true behavior, put that limit in the note.
The research paper analysis guide gives a wider way to check methods and results against source text.
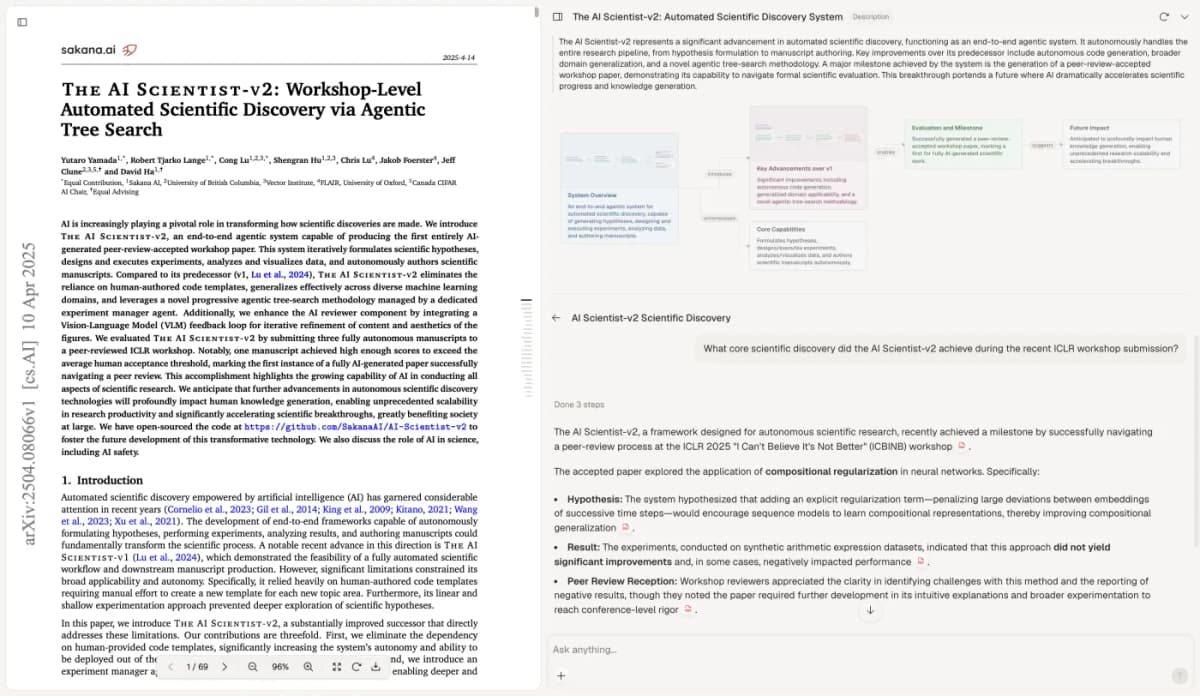
The screenshot shows the citation review surface with a research paper. It does not show the fictional survey, detect biased answers, or estimate the size of a bias. The researcher checks source context and owns the final interpretation.
State what the evidence cannot show
A risk label does not tell you how many answers changed, which people changed them, or what they truly believe. A social-desirability scale also cannot turn one answer into a confirmed lie.
Report what the study measured and how. Keep the question's words, interviewer, privacy, and mode apart from any answer gap. Then name other causes that may explain the gap.
The Pew experiment found that effects varied by item. One fix cannot fit all questions.
The Pew survey-question guide also shows why the exact words and answer choices belong in a methods check.
If the paper lacks detail, say so. A clear limit is better than guessing why people answered as they did or rejecting all self-reports.
Atlas
Check study context in Atlas
Compare source passages, inspect citations, and save a qualified note.
Frequently Asked Questions
It is a tendency for a respondent to give an answer they perceive as socially acceptable, which can make self-reported data less accurate.