

A cross sectional research design looks at a sample during one study window. It can show how common a trait is or how groups differ. It does not track each person's change through time.
Suppose a library asks volunteers how sure they feel about their work and checks who has had training. The trained group scores higher.
This alone cannot show that training raised the scores: the groups may have differed at the start, and the survey has no score from before the course.
Before you choose this design, compare the methods in published papers. Ask who joined the sample, when and how they were tested, which records were used, and what the study can claim. The worked examples below keep those facts apart from your own study plan.

Compare study methods in Atlas
Check cited methods and save a design note with its limits intact.
What makes a study cross-sectional
The key feature is how the study treats time. You observe the units of interest during one study window, without tracking their change across waves. A unit might be a person, home, school, or firm. Data might come from a survey, test, exam, direct observation, or file that already exists.
“One time” does not mean everyone must answer on the same day. Fieldwork can take weeks, and a survey file may pool a longer period, as the NHANES methods report illustrates.
State when the team gathered the data and what period each item covers. A question about last month's work asks people to recall the past, even if they answer it today.
A peer-reviewed methods guide explains how a snapshot helps study prevalence and links between traits. Prevalence means the share of a defined group with a condition during the period of interest. Incidence is different: it concerns new events over time. A count of current cases cannot tell you how fast new cases arise.
Match the design to your question
Describe a current state
Use a snapshot when the question asks what is present in a defined group. A library might ask what share of active volunteers feel ready for their work.
The aim is a current proportion, with a clear meaning for “ready.” That is a different question from how much a training course changed their skills.
Compare variables across people
You can also ask whether two traits are linked. For example, do current scores differ between people with and without training?
Set out that question before you read the results. A useful research objective names who you will study, what you will record, and which link you want to test.
If the cases are districts or schools and both measures describe those groups, use the ecological study design guide to check the level of your claim. Group-level analysis can use a cross-sectional window; a pattern across groups does not establish the same link for each person within them.
Track change with the right units
If you ask how much each person's score changed, one current score is not enough. Use a longitudinal research design to plan repeated observations and link each person's records across time.
Comparing older and younger people today does not show how today's younger group will change as they age. Simply Psychology's design guide explains this gap between group contrasts and change in one person.
Repeated cross-sectional surveys draw new samples from a target group over time. They can show trends in that group if the samples and tools support a fair comparison.
They do not show each person's path. A panel returns to the same people and can track their change. State which units recur; do not choose a label just from the number of survey years.
Check whether the practical savings matter
A single survey wave often costs less than repeated follow-up. It lets you study several traits at once without having to keep the same people in later waves.
But finding people, testing questions, seeking consent, and checking data still take work. Scribbr's methods guide outlines these uses and tradeoffs. Check that the design can answer your question before weighing the time it saves.
Read the methods before the results
Start with the methods section, then check the results and stated limits against it. Keep facts from the source apart from ideas you propose. If you have only an abstract, mark that access limit and leave missing facts unknown. A short account may give enough to spot a design, but not enough to repeat the study.
Population and recruitment
Name the target population: the full group you want to learn about. Then note the setting, who could join, and how the team chose the sample. A national random sample and people who opt in at one service support different claims.
The NHANES sampling account specifies its target and selection design. Check who was asked, who replied, and who had little chance to take part. A large sample can still miss the people your question concerns.
Dates and measurement
Record fieldwork dates, the period each item covers, exact wording, scoring, and where the data came from. Keep recalled history distinct from a test at the visit. Three readings during one exam help check the value at that visit; they do not create three follow-up waves.
The NHANES figure's footnote reports repeated blood-pressure readings within its sample. Use operationalization to connect a broad concept such as confidence to the item or score the team used.
Analysis and missing records
Note how many records were used for each outcome, which were left out, what was missing, and which survey weights were applied. A simple proportion needs both the count of cases and the full group counted. A complex survey needs weights and error estimates that match its sampling plan. Dividing raw counts does not yield a national estimate by default. The STROBE statement helps authors report these methods clearly; it does not approve a design or score study quality.
Compare two published method accounts
These examples compare a full government methods report with a published survey's structured abstract. Their different scope helps show what you can learn from each source. Before borrowing either study's methods, check how its sample and tests fit your question.
The NHANES report describes a national survey using interviews, exams, and lab tests. Its pooled file covers 2017–March 2020.
The BMJ survey abstract describes a postal questionnaire among treated asthma patients at one general practice. Read each table cell as a source fact. The final column shows a limit to retain when you borrow a method.
| Method question | NHANES report | BMJ survey abstract | Limit to retain |
|---|---|---|---|
| Who was studied? | Civilian noninstitutionalized U.S. residents in a complex probability sample | Treated asthma patients aged 17–65 at one practice | A local practice sample cannot stand for a national population |
| What is the time frame? | Pooled 2017–March 2020 prepandemic file | One postal survey; fieldwork dates absent from the abstract | Publication year is not a substitute for collection dates |
| How were outcomes measured? | Interviews, standardized examinations, and laboratory tests | Nijmegen questionnaire score of at least 23 | A questionnaire threshold and an examination measure are different evidence |
| Who entered the analysis? | Outcome-specific samples and exclusions shown in the report's flow | 227 questionnaires returned; 219 suitable for analysis | Returned records and analyzable records have different denominators |
| How far can claims go? | Weighted prevalence estimates for the named file and population | Scores suggestive of a condition; further validation needed | Neither account alone establishes a treatment effect |
Table 1: Use the comparison to identify missing design facts before writing a rationale; check the NHANES full methods and BMJ structured abstract for the source scope of each cell.
The abstract's conclusions report a screening score without establishing a confirmed diagnosis. Since we have not reviewed its full methods or checked the tool's validity here, that access limit belongs in the note. Keep gaps visible until you can read the source, even if another study's procedure seems to fit.
Read an analysis flow correctly
The NHANES sample-flow figure below starts with 15,560 people and splits into outcome samples. Children enter body-weight and dental branches, while adults enter blood-pressure, body-size, or fasting-sample branches. The tooth-loss branch is for older adults. Each path narrows through age rules, exam visits, exclusions, and missing tests to show who enters an analysis. The arrows do not show follow-up visits. Since one person may enter several branches, you cannot add the branch totals as distinct people.
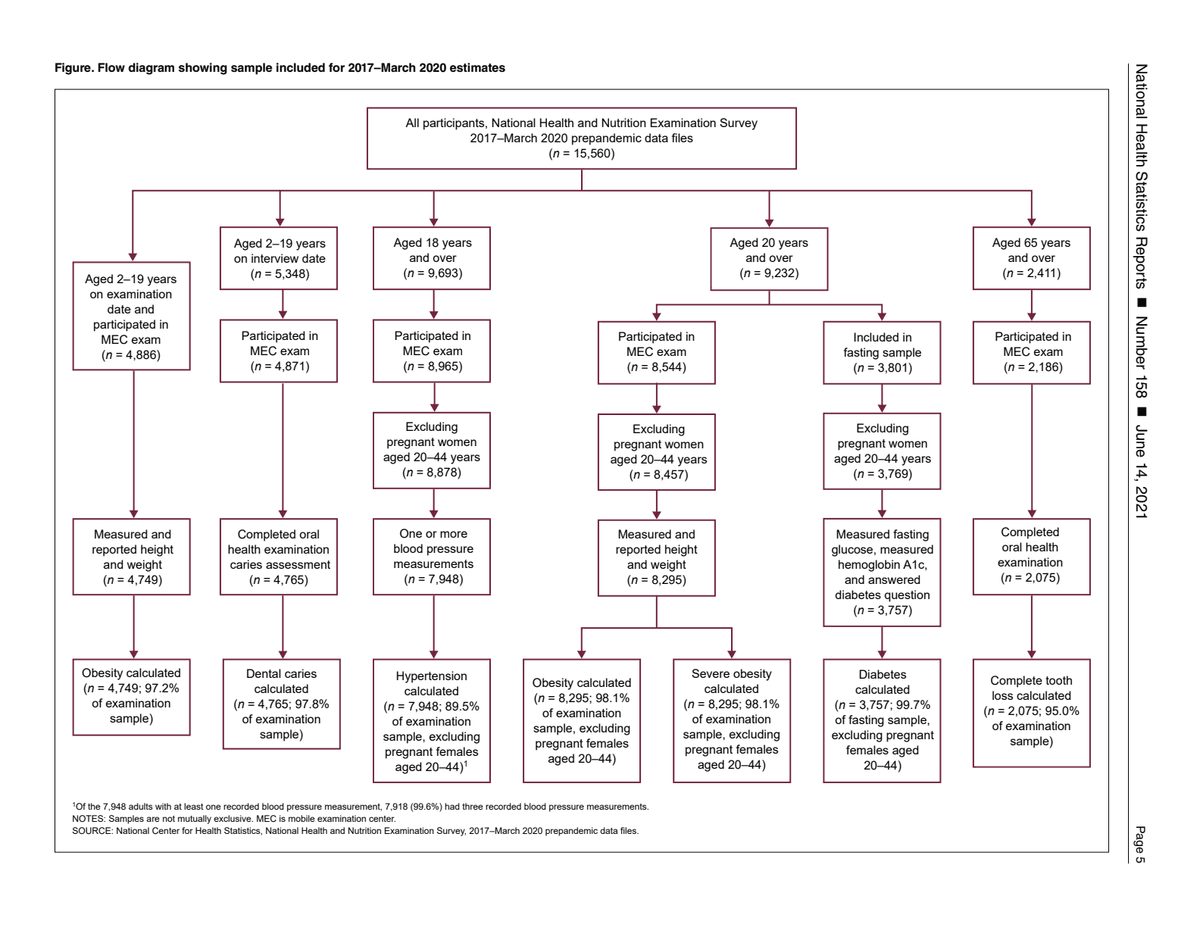
Stierman and colleagues, National Center for Health Statistics, National Health Statistics Reports 158 (2021), page 5. Complete page reproduced without content changes. The report's public-domain notice permits reproduction.
Each outcome has its own count of people used in the analysis. The arrows show who enters that count, rather than changes in health through time.
The report also gives a limit specific to this file. The pandemic stopped fieldwork, leaving the partial 2019–March 2020 sample unable to stand for a defined population by itself. NCHS pooled it with 2017–2018 and made special weights.
Its file-use guidance warns against splitting those pieces to compare national trends. A file's date range does not mean every time comparison you could run is valid.
Set limits on the claim
Keep timing separate from association
When you assess two traits together, you may not know which came first. People who feel more sure of their skills might seek training. Training might change their scores, or prior work might affect both. Putting one trait on the predictor side of a model does not settle the order of events.
The useful rule is that a snapshot alone does not establish a cause. That does not mean causal analysis is impossible with every such file.
A 2026 methods abstract discusses stronger approaches when the order of events is known or genetic or instrumental-variable evidence is suitable. Using those methods requires extra assumptions and expert review, beyond what the simple survey here tests.
Review other explanations
A confounding variable can affect both who takes training and how sure people feel about their work. Past service is a plausible factor in this example. Recording it may help test an explanation.
Adding it to a model does not ensure that all confounding is gone. Use subject knowledge to decide which factors matter, then check how well the study recorded them.
Selection matters too. If people who feel unsure skip the survey, replies may paint a more positive picture than the full roster. State how response and missing data limit the claim.
Weights or a larger sample cannot fix every form of selection by default. Check the assumptions behind a correction before claiming it solves the problem.
Distinguish current cases from new events
A snapshot of current cases can reflect both how often a condition starts and how long it lasts. A case that lasts longer has more chance to appear in the sample.
The 2025 methods guide explains this duration-related bias. Do not treat the share currently affected as a rate of new cases without data on new events and time at risk.
Let these limits shape the sentence you write. “Current scores differed across training groups” states the finding, whereas “Training raised scores” adds both change and a cause. If the source cannot support the stronger claim, keep the first sentence and explain what a later study would need to test.
Write a defensible study rationale
This is an original fictional plan. No one has been surveyed, no scores have been gathered, and no effect has been estimated. It shows how a design choice follows from a question and the facts needed to answer it.
Define the narrow question
A library wants to know whether current confidence differs between active volunteers with and without its training. It has a roster, training records, and a draft survey item. It wants to describe those groups now, before planning a deeper study. That narrow aim fits a snapshot better than a claim about what caused the scores.
The team first defines the target group: active volunteers on the roster during a named study window. It checks whether the item means the same thing to new and long-serving people: “Ready to help” might mean knowing the software, answering common questions, or handling a hard request. One vague score could hide several different skills.
Explain the chosen design
A suitable rationale could read:
We propose a cross-sectional survey of active library volunteers during one study window. We will compare current self-rated confidence by recorded training status. We will state who can join, how many are asked and reply, the survey item, and missing replies. The study describes current group differences. It will not estimate each person's change or a causal effect of training.
This paragraph connects the question to the plan. The score comes from how people rate themselves, and the plan has no skill test to check how well they perform.
It keeps the source of training status, so the team can check how records treat old or unfinished courses. Exact dates, wording, sampling, and analysis still belong in the full protocol.
Correct an unsupported rationale
“We will use a cross-sectional survey to prove that training improves confidence” promises facts the plan does not gather. Remove “prove” and “improves.” Keep the current-group comparison and note the lack of scores before and after training.
If the real question needs a causal effect, seek expert help with a new design. Changing the label on the same survey cannot close that gap.
A longitudinal plan could add repeated scores for the same people to show observed change and timing. It would still need to address why people receive training and what else changes during that period. More waves strengthen some claims; they do not make groups alike or establish a treatment effect by default.
Compare the sources in Atlas
Use Atlas to keep the chosen reports and checked design notes together. Compare the sources to inform your judgment. An AI answer is a draft account, so check each key cell before you reuse it in a study plan.
Name the source state
Create or open the project with the sources you are allowed to use. Label the NHANES file as the full 2017–March 2020 methods report and the BMJ item as an abstract. Keep your library plan in its own note, marked as a proposal. Wait until added sources are ready to read before asking about them.
Start a chat, type @, and select the sources and study note you mean. Choose Project only to keep new retrieval within your project and supplied text.
Earlier chat context remains available, including outside sources already in the chat. Start a fresh chat if that old context could blur which sources you want to compare.
Ask for methods and missing facts
Enter a bounded question:
Compare the named method sources: who was studied, when, how they were tested, which records were used, and what they can claim. Support each source fact with a citation or passage. Mark facts missing from the abstract as unknown. In a separate section, check whether my library plan can describe current group differences. Do not invent past scores or say that training caused improvement.
This question keeps published facts apart from your plan. If the answer merges them, ask for a source-facts table first and a draft rationale next, checking each cited passage before accepting a claim that sounds right.
Open citations and save corrections
Open the numbered citations beside the sample, date, and test claims. Read each passage and the text around it.
A PDF citation may open a precise page when an anchor is available. If it does not, find the section in the source. Check that the answer keeps fieldwork dates, publication dates, and the question's recall period distinct.
For this example, reject a cell that calls the BMJ score a confirmed diagnosis, adds NHANES branch totals as distinct people, or promises a training effect. Correct the table, keep unknown facts, and add the source access limits. If needed, ask for a new rationale based on the corrected note.
Select New, then Note, and save the checked table and rationale in the project. Keep source names, pages, open questions, and the intended claim together. Wait for Saved before closing.
Atlas helps you organize and compare sources. You remain responsible for the design, analysis, and meaning of the findings.
Check the plan before collection
Before collection, check whether the question matches who can join, how they will be asked, when you will gather data, what the items mean, and which records you will use. Those choices also inform the required ethics and data-access review, which must happen before gathering or importing data about people.
Ask a methods reviewer to check sampling, error estimates, confounding, and missing-data choices. The table makes those choices visible, but cannot certify them; leave open questions and blank cells in the plan to name the evidence still needed.
The final rationale should say what the snapshot can describe and what stays unknown. If the question depends on change or cause, resolve that design gap before you gather data. Keep the claim within what the study can test, and retain the checks that led you to that choice.
Compare study methods in Atlas
Check cited methods and save a design note with its limits intact.