

An ecological study design compares measures for groups, such as districts or states. The exposure and outcome are reported at that group level. A pattern across districts does not by itself show the same link for each person within them.
Start by checking what one data row means and how each measure was built. Then keep the paper's group-level result apart from claims about people or causes. The worked note below shows how a district transport measure can be misread as a pupil's bus use.

Keep group measures and claims aligned
Compare group measures and check the claims they support.
Identify the group being compared
Here, ecological refers to the level of the study, not just its topic. The Zeoli methods guide covers group-level questions and designs, including laws and change in communities.
Find the cases compared in the actual analysis. Districts may be the cases even when raw counts come from people. A large count of people does not turn a district-level table into a study with linked records for each person.
The broader unit-of-analysis guide helps distinguish what a claim describes from the records used to build its measures. Trace both the group and the way the records were brought together.
A study can compare group measures at one period or follow groups over time. The guide's design section describes both. Ecological level and cross-sectional timing are distinct questions; record both when the paper states them.
Check what each measure means
Write the exposure in the paper's terms. It might be a law in force, a mean value, a share, or a count divided by an area or number of people. Those forms do not imply that every group member has the same exposure.
An area with many bus stops is not a list of people who use buses. Check whether the authors describe service supply, access, use, or a proxy for something else. Keep that meaning beside the source location.
For an outcome rate, record what is counted and what it is divided by. This divisor is the denominator. The CDC data guide explains why rates account for group size or time. A bare count and a rate answer distinct questions.
The people covered by two measures may also differ. A transport measure could use everyone who lives in the area, while an absence measure covers pupils on the school roll. State the gap rather than assuming both describe the same people.
Read the area limits and dates. A city's service count from one year may not match a later school catchment. If a source does not explain how the area changed, leave that matching question open.
Finally, find the result the authors actually report. CDC's ecological-study explanation distinguishes group measures from exposure for each person. Keep the result's level clear before writing a broader claim.
For a made-up rate example, 50 stops in an area with 2,000 people means 25 stops per 1,000 people. It does not mean each person has access to 25 stops or uses one of them. The measure states supply relative to area size in people.
For a made-up school week with 20 pupils and five days, there are 100 possible pupil-days. Ten missed days gives a rate of ten per 100. Those days could be spread across pupils or concentrated among a few; the total alone does not tell you which.
Worked district-level evidence note
All records, labels, numbers, and findings below are made up to teach the reading task. No transport study was run and no data came from real pupils or districts. The four source labels belong only to this example.
Suppose a paper compares twelve districts. Its exposure is bus stops per 1,000 residents in 2024. Its outcome is missed pupil-days per 100 possible pupil-days among enrolled pupils in 2025. The two measures divide their counts by distinct totals and cover distinct periods.
One made-up district has 25 stops per 1,000 residents and 10 missed days per 100 possible pupil-days. A second has 50 stops per 1,000 residents and five missed days per 100 possible pupil-days. These are teaching numbers, not real estimates.
The report says it found a negative association across the twelve districts: more stops goes with less absence. No coefficient, adjustment result, or pupil bus-use record is supplied here. The district pair shows the measures; it does not prove a statistical result.
| Invented source record | What is reported | Group-level meaning | Limit on the claim |
|---|---|---|---|
| Methods M1, cases | Twelve districts are compared | Districts are the analytic cases | Does not describe twelve individual pupils |
| Measure E1, exposure | Stops per 1,000 residents in 2024 | District service supply relative to residents | Does not show which pupils used buses |
| Measure O1, outcome | Missed pupil-days per 100 possible pupil-days in 2025 | Absence rate among enrolled pupils | Does not link a pupil's bus use with that pupil's attendance |
| Result R1, pattern | Negative association across district measures | More stops accompanies lower reported absence in this fictional account | Does not establish a bus-use effect, causal mechanism, or correct analysis |
Table 1: A loose summary might say pupils who ride buses miss fewer school days. That changes the exposure from district stop supply to each pupil's bus use. It also moves from a group pattern to a claim about people.
A closer account would say the made-up report describes a link between more district bus stops and lower district pupil absence. Whether pupils who used buses had lower absence is unknown. The actual bus-use and attendance links were not supplied.
Keep a question in the note: what data and methods would support that claim about pupils? Atlas can help find any supplied account of linked records. It cannot create those records from area totals or certify a new inference.
This is the risk behind ecological fallacy. A group-level pattern is being asked to support a claim at a finer level. The CDC guidance gives a similar warning for area exposure and case data.
Preserve gaps in cross-level claims
Group means can hide differences within the group. Wakefield's review abstract describes this loss of detail for exposures and other factors. A mean does not say how each person's exposure and outcome fit together.
A significant group correlation would not restore that missing link. Salkeld and Antolin's study uses odd group-level patterns to warn readers against causal stories. It is not proof that fried chicken protects against disease.
Their full paper's methods and discussion show how grouping states matters to the pattern. In your paper, record the chosen groups and any checks at other levels. Do not assume a smaller area solves the problem by itself.
Other factors may explain a group pattern. In the made-up note, district wealth, school rules, and how missed days were recorded are open questions, not proven causes. A methods reviewer must judge what the analysis addressed and what remains unknown.
The study-limitations guide helps keep a reporting gap distinct from a known flaw. If the paper leaves out adjustment details, say those details are missing; do not claim that no adjustment took place.
Ecological studies can still answer group-level questions. Prince's library review describes group book-loan and area measures. Keep such findings at their stated level rather than treating them as a direct measure of each child's reading or learning.
Compare aggregate source passages in Atlas
Add the paper, measure notes, and guidance you are allowed to use. Wait until processing finishes. Keep source titles distinct, and include the supplement if it states what the counts are divided by or how areas are defined.
Choose Ask a question and mention the files with @. Select Project only beside + to keep new retrieval within the project. Use a fresh chat when earlier outside material would confuse the task; that control does not erase earlier context.
Ask: “Build a group-level evidence note from these files. For each exposure and outcome, state the group, measure, denominator, people covered, area, period, and source location. Identify claims that require person-level links not present here. Keep source conflicts and missing details open.”
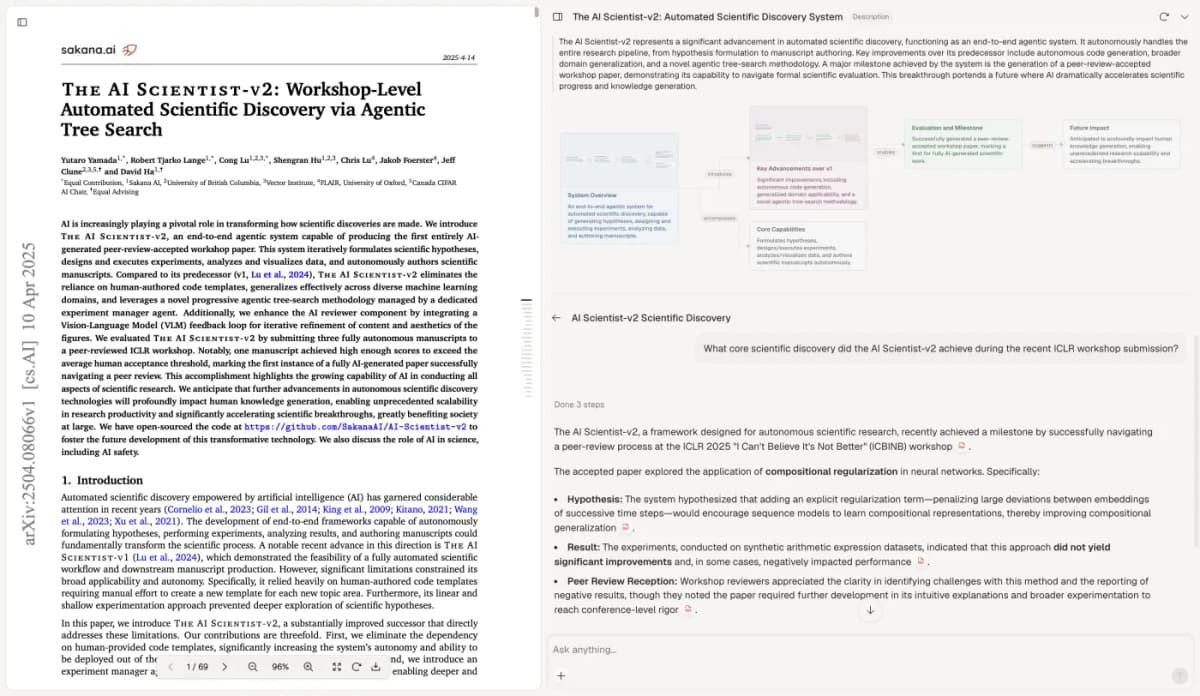
This real archive image shows another paper and citation inspection. It does not show the fictional districts, an ecological analysis, or a verified cross-level claim.
The displayed paper is The AI Scientist-v2, by Yamada and colleagues, under CC BY 4.0. The capture retains the original pixels.
Open each cited passage and read the nearby terms. A result sentence may depend on a measure described elsewhere. The source-checking workflow helps narrow wording to what the text actually supports.
If the answer calls stop density bus use, correct the measure name. If it gives each person the district mean, remove that claim. Ask for the named source again when a citation points to the wrong file.
Compare terms that conflict before blending them. A report and an older measure note may cover distinct areas or dates. Follow the broader paper-synthesis workflow while keeping the source of each version clear.
Save the corrected note through New, then Note. Add its title and text, and wait for Saved. Keep group-level results, person-level gaps, and your questions for methods review together.
Atlas supports reading and notes. It does not run statistics or fieldwork, restore lost data on people, prove causality, validate measures, or certify an analysis. Keep judgment with the researcher and the required methods review.
Save a claim at its supported level
The note should let a reader find the group, exact measures, dates, totals used to form rates, stated result, and open questions. Keep a source location beside each fact. Use the paper's language when a term's scope is unclear.
For the made-up example, the safe claim concerns district stop supply and district pupil absence. The claim about bus use by pupils lacks support, and cause and effect remain unproved. New source detail may change the note; a smooth summary alone cannot.
Keep that limit in the next paragraph or report that uses the note. If you later obtain linked data or a revised analysis, record what changed and which claim it now supports.
That record makes a stronger later claim open to checking. It also shows why the earlier note was limited, without pretending the missing data had been there all along.
Keep group measures and claims aligned
Compare group measures and check the claims they support.