

A sampling frame is the source used to draw a sample. It might be a school roster, a list of firms or a map of survey areas. The key question is who or what could be chosen from that source.
A report can name a broad group while using a narrower frame. Before accepting a claim about the whole group, check the methods against the frame and record any gaps.

Check the frame behind the study
Compare the stated population with the frame and save the evidence gaps.
What a sampling frame contains
The target population is the group the study wants to describe. The sampling frame gives the units from which the sample is drawn. These groups can differ even when the draw is random.
Statistics Canada’s archived frame guidance covers both lists and area frames. A frame need not list names: it can mark areas through which people are reached.
The selected sample holds the units chosen from the frame. The respondents are those who supply data. A school roster, the students chosen from it and those who answer are three distinct sets.
Keep these stages separate when reading a study. Missing names are a frame problem; selected people who do not reply raise a nonresponse question. Neither can be resolved by reporting the final sample size alone.
Recognize list and area frames
Lists identify eligible units
A list frame might use school records to choose students or a list of firms to choose work sites. Check what each entry stands for. One account can belong to more than one person, and one firm can have several sites.
The MacEwan sampling chapter uses a student list to explain a frame. That example helps name the source; a real study still needs its own dates and rules for who belongs.
Areas support selection in stages
An area frame divides a place into units such as blocks. A survey might choose blocks, then list homes in those blocks and choose some homes. The first frame need not name each person.
Chapter 4 of the UN household sampling handbook explains area frames where full lists of homes are hard to get. Read each stage: a map and a list of homes serve different roles.
Multiple sources need overlap rules
One source may not cover the whole group. A study might use a list and a map together. Ask how it handles people found in both sources and whether those found in neither can enter the sample. Keep each source’s date in the note so a later check uses the same files.
Two lists can share both names and gaps. Record how the authors handle overlap. A plan to join frames needs rules for the draw as well as a way to merge files.
Check a frame against its population
Establish the source boundary
Start with the exact target-group statement. Note place, time and who counts as a member. “Adults living in the district in September” differs from “adults on the library list at the end of August.”
Find the method passage naming the frame. Look for a list, map, database or field count. If the text only says how people were asked to join, note that it does not clearly name the source used for the draw.
Check the sampling unit at each stage. If the study first picks homes and then people in them, keep that sequence clear. The MacEwan discussion of sampling units helps distinguish the entity studied from the unit first drawn.
Check currency and coverage
Record when the source was made or last checked. A new report can use an old roster. It may miss new members and still list people who have left; look for rules that check who still belongs.
Look for missing groups, names listed twice and people outside the target group. Does the report show checks for these problems, or just call the frame sound? Keep a claim with no source support marked for review.
Keep a source fact apart from its possible effect. A missing group shows a gap in reach. Its effect on an estimate depends on the outcome, how that group differs and the method used. A note cannot supply missing data.
Worked check of a library survey
Suppose a fictional study asks how adults in a district spend time reading. The methods say names were drawn at random from a library member file. The team took the file in August for a September survey.
The example supplies no response rate or findings. Use these source facts to build a frame evidence note. Leave open how the list was kept up to date and whether it covers the whole target group.
| Check | Fictional source fact | What the note should record |
|---|---|---|
| Target | Adult district residents in September | Population includes library nonmembers |
| Frame | Registered-member file | Selection is limited to listed members |
| Date | August export | September additions may require a separate check |
| Eligibility | District residence required | Current residence checks are not described |
| Duplicates | Handling not reported | Unique-person selection cannot be assumed |
Table 1: The statements are fictional; each row in a real note needs a study passage or frame document.
Correct the scope statement
“Random selection represents all adult residents” goes beyond these facts. Replace it with “The selected units came from the library member file.” Then record that coverage of adult nonmembers is not established by the reviewed methods.
Do not call the result unbiased simply because the wording is narrower. The study may also face response or measurement problems. Selection bias concerns the wider process through which people enter and remain in an analysis.
Request the missing evidence
Ask when the frame was checked, who was allowed on it and how repeat entries were handled. A second source may help check its reach, but the dates and group rules must match before you compare counts.
If there are no further records, retain the gap. An undercoverage assessment can focus on missing groups; this note names the source used for the draw and what it shows. Statistics Canada’s documentation guidance calls for stating population differences and coverage problems.
Save a frame comparison in Atlas
- Add the study, methods appendix and frame documentation to one project. Use descriptions or approved extracts you are entitled to share; personal identifiers are unnecessary for this reading task.
- In Ask a question, type @ to select these sources. Ask: “Compare the stated target population with the sampling frame. Cite the unit, date and eligibility rules. Separate reported coverage from missing information.”
- Open each citation and read the surrounding passage. Check whether “sample” means selected units or respondents. If an answer claims the roster is complete, find the passage that establishes completeness.
- Correct unsupported conclusions. In the library example, replace “all residents could be selected” with “listed members could be selected.” Keep nonmember coverage and update procedures unresolved.
- Select New → Note, give the checked comparison a clear title and wait for Saved. Preserve source facts, open questions and the scope statement so later evidence can change the note.
The screenshot shows a source on the left and a cited answer on the right. Read them together to check a claim. Its AI paper is not the library study; the image shows how to inspect text, not a frame audit result.
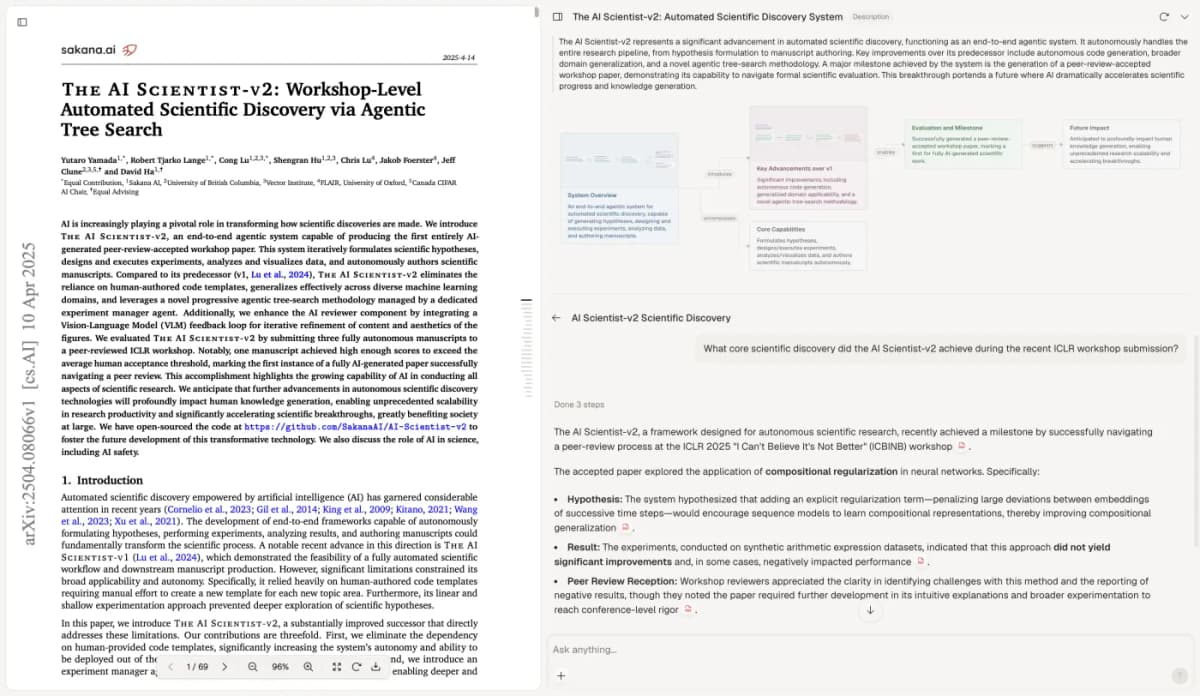
Read the cited passage before treating an answer as evidence about a sampling frame. Visible paper: The AI Scientist-v2, Yamada and colleagues, CC BY 4.0. Screenshot copied unchanged.
Use a multi-source synthesis workflow when the plan and report describe different frames. Keep planned steps apart from what was done. You still need to judge reach and choose any change to the design.
Match the conclusion to the evidence
Return to the study claim with the note. Name the target group, the frame source and the known gaps. Ask for more detail when the frame cannot support the scope of the claim.
For several studies, use a paper-analysis workflow to compare the same fields. Two samples of the same size can come from very different frames. Jim Frost’s frame criteria offer a useful check on list quality.
If the frame is sound but people choose whether to join, examine voluntary response bias. AAPOR’s survey guidance distinguishes probability recruitment from opt-in sources; appearing on a list and taking part are different steps.
When methods are vague, use AAPOR’s disclosure checklist to request the sampling source and recruitment details. Clear disclosure makes the next review possible; it does not certify the frame.
Check the frame behind the study
Compare the stated population with the frame and save the evidence gaps.