

Nonresponse bias can arise when people who do not reply to a survey differ from those who do on the thing it measures. Missing replies matter because answers from those who reply may give a skewed estimate for the wider group.
A response rate describes part of what happened to the chosen sample. It does not by itself tell you whether bias is present. Read what the report says about each group and its follow-up before using a rate to judge the result.

Check who replied to the survey
Compare invited and responding groups and record the missing evidence.
What nonresponse bias means
The key question is how missing replies relate to the outcome. In a workload survey, staff who are too busy to reply may work longer hours than those who answer. That is a possible cause of bias; the report needs facts to show it occurred. Ask which source supplies those facts before carrying the claim into your notes.
AAPOR’s Standard Definitions states that response-rate information alone cannot determine the presence or size of nonresponse error. There is no single rate that proves every estimate safe or biased.
Groups may differ in ways that affect some answers more than others. A work role may matter for hours worked but have little effect on another question. Keep the outcome attached to the bias claim.
Response bias is a different concern: it involves the answers supplied, such as answers changed by question wording. Nonresponse concerns data that are missing. A study can face both, so a checklist label does not settle the review.
Identify the groups behind the rate
Selected, invited and responding people
Find the group chosen for the survey and the source from which it was drawn. Then check who was reached and who supplied usable data. The sampling frame is the source for the draw; it is not the group who finally replied.
If target members never appeared on that source, examine undercoverage before interpreting missing replies. The distinction matters because a reminder to selected people cannot reach those left out of the draw.
Some selected people may turn out to be outside the study’s rules. Others may have unknown status. US Census rate guidance separates eligible, ineligible and unknown cases before response status is interpreted.
Whole surveys and missing items
Unit nonresponse means a chosen person or unit supplies no usable reply. Item nonresponse means an answer is missing from a usable reply. A count of returned surveys cannot tell you how many people answered each question about work hours.
Check the base for the estimate. AAPOR’s case definitions set out what happened to each chosen case. Save the authors’ rate formula and its terms; do not guess a rate from headline counts.
Open entry is another starting point
An open survey link may not have a fixed chosen group or a known count of people who saw it and could take part. Do not call replies divided by page views a standard response rate unless the source supports that use.
Use the voluntary response guide for self-selection into an open poll. For the broader question of who stays in an analysis, trace the selection process as well.
Worked check of a staff survey
Suppose a fictional report asks about hours worked by staff across a firm. A roster is used to select workers, who receive email invitations. The report lists usable replies by work role but gives no outcome data for workers who did not reply.
No counts or workload estimates are supplied here. Build a comparison-gap note from these statements. Keep what happened to the chosen group apart from what you would need to know about missing hours.
| Check | Fictional reported fact | Gap to record |
|---|---|---|
| Selected group | Workers drawn from a staff roster | Roster date and coverage need checking |
| Contact | Email invitations were sent | Delivery failures are not described |
| Response | Usable replies reported by role | Role-specific response bases are missing |
| Outcome | Hours reported by respondents | Missing workers’ hours are unknown |
| Follow-up | Reminder sent before closure | Late and still-missing groups are not compared |
Table 1: The scenario is fictional. Replace each fact with a cited study passage when using this note.
Correct an unsupported interpretation
“The missing workers were busier, so the estimate is too low” asserts an outcome and a direction the report does not establish. Replace it with “The report does not show how hours differ between workers who replied and those who did not.”
This wording keeps a useful concern without claiming to know missing data. Use a paper-analysis workflow to keep the reported result, possible cause of bias and source gap in separate fields.
Keep the denominator visible
If the report later gives a response rate, save its base and rules for cases outside the target group. A reply total is not enough to work out a standard rate when it is unclear who could take part or how part replies were counted.
Ask for the case-status table or methods appendix. AAPOR’s rate overview explains the need for clear case codes. For this task, save the stated method rather than guessing how the missing cases were counted.
Evaluate comparison and follow-up evidence
Compare available baseline facts
Look for facts known for both groups, such as job role from the roster. These facts may help flag a risk. A match on one known feature does not prove that hours worked are the same; those hours are still missing for some staff.
Pew’s 2017 telephone-survey study checked estimates against other surveys. Some topics showed more bias than others. That is a reason to check each outcome rather than rely on one response-rate rule.
Ask what follow-up establishes
A reminder can bring more people into the respondent group. It does not reveal the views of everyone still missing. Record who was reached, what was asked and whether the follow-up itself had missing replies.
Late replies are sometimes used to infer what missing people might say. The Catalogue of Bias discussion explains the model behind this approach. State that assumption; late replies are not a direct count of the people still missing.
Check adjustments and benchmarks
Weighting or imputation may help when their assumptions hold. Ask what facts were known, which model was used and how the team tested the result. “Adjusted for nonresponse” alone supplies none of those details.
Pew’s analysis notes that weighting can leave bias on features it does not cover. This is a dated study, not a guarantee about a new survey.
Benchmarks also need matched groups, dates and questions. A staff total from an earlier year may not check a new measure of hours worked. Use source synthesis to compare those terms before treating a match as proof.
Save a comparison-gap note in Atlas
- Add the survey report, methods appendix and follow-up note to one project. Include approved group descriptions; individual worker records are not needed for this text-review task.
- In Ask a question, use @ to select these sources. Ask: “Compare selected, invited and responding groups. Cite the rate definition and any respondent/nonrespondent comparison. Mark missing outcome evidence separately.”
- Open each citation. Check whether the passage describes all selected workers, only usable replies or only one item’s answers. Read surrounding definitions before assigning it to a group.
- Correct any claim that missing workers had higher workloads unless the source supplies that evidence. Keep the unanswered comparison in the staff example and retain the authors’ own qualification.
- Select New → Note, save the group trace, denominator and outcome gap, and wait for Saved. Add new follow-up evidence later without erasing the original basis of the note.
The screenshot places source text beside a cited answer. Read them together to check a claim about a group. Its AI paper is not the staff survey; the image shows how to inspect text, not a completed bias test.
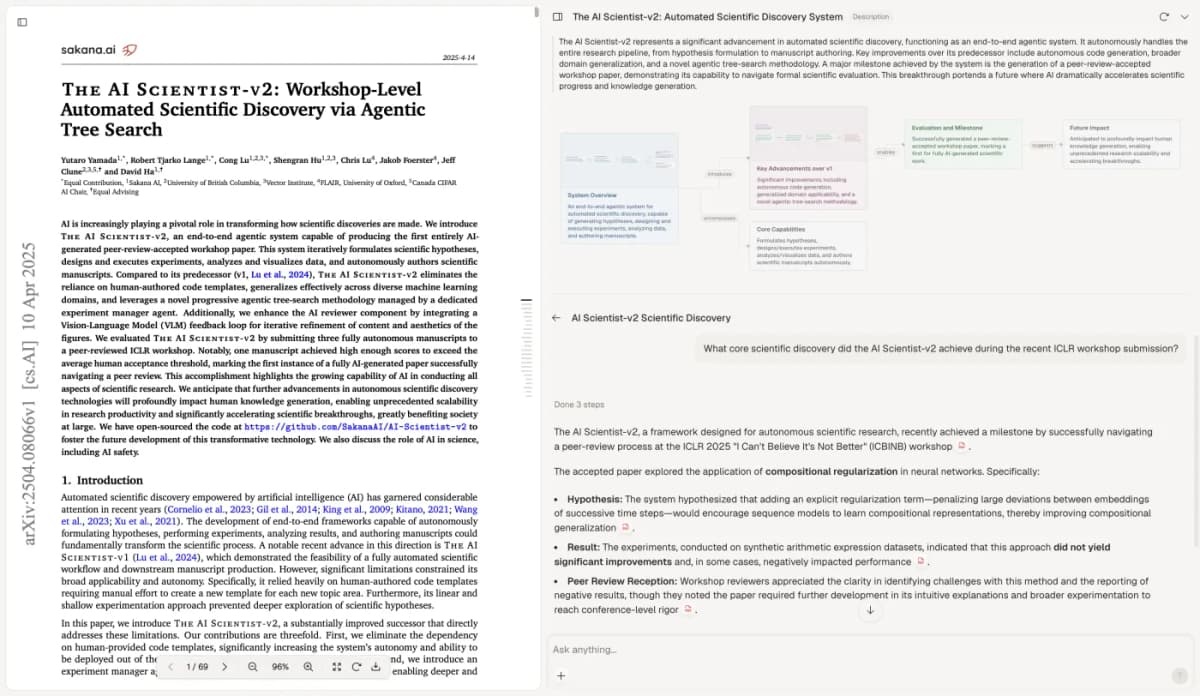
Check which group the cited text names before using it to support a comparison. Visible paper: The AI Scientist-v2, Yamada and colleagues, CC BY 4.0. Screenshot copied unchanged.
Researchers still judge the method. The note keeps gaps clear; it cannot supply missing outcomes or prove that a change to the analysis removes bias.
Report the unresolved response question
State the known group facts and the missing outcome check. Keep the reported rate formula alongside the concern. Ask for facts that could show whether the possible cause of bias actually changed the estimate.
For several studies, a literature-review process helps compare the same gaps. Keep each survey’s outcome and response base clear instead of ranking quality by rate alone.
Check who replied to the survey
Compare invited and responding groups and record the missing evidence.