

Voluntary response bias can arise when people choose to take part in a survey and that choice is linked to what the survey measures. An open poll may attract people with strong views while missing those with little reason or time to reply.
To judge a poll, trace who could see the link, who chose to join and which group the claim names. How people joined can flag a risk. It does not tell you which way the bias goes or how large it is.

Trace who chose to take part
Compare opt-in recruitment with the population named in the claim.
What voluntary response bias means
A voluntary response sample lets people choose to enter, as with a public poll link. If those who join differ from the target group on the outcome being measured, estimates for that wider group can be biased.
The problem is the link between entry and the answer. A bus-service poll may draw people who had a bad journey, frequent riders keen to support the route, or both. Open entry alone does not show which effect is stronger.
Consent is a separate issue. A study can choose people at random and still ask them to agree to take part. AAPOR’s sampling guidance treats the route into the sample and the way people answer as distinct choices.
Online surveys can draw people through a probability sample or an opt-in source. Ask how people were chosen. The screen, survey link or request for consent does not tell you how the sample was drawn.
Separate choice from other sampling problems
Open entry and missing replies
In an open poll, people decide to enter after seeing a link. In a survey with a fixed chosen sample, some of those chosen may not reply. That second question concerns nonresponse, though both processes can occur in one study.
AAPOR’s disclosure guidance asks teams to state how they recruited and chose people. Look for those details before judging the method from a phrase such as “participants volunteered.”
Reach and choice are distinct
People without access to the invitation may never have a chance to join. Those who see it may choose not to reply. A poll shared only in a riders’ social group can have both limited reach and self-selection within that group.
Start with the sampling frame when the issue is who could be selected. Check undercoverage for missing target groups. The broader selection process includes entry and exclusions from the final analysis.
Entry bias and answer bias
Voluntary response bias concerns who supplies the data. A leading question can sway what people say. A fair question can still be answered by a skewed opt-in group. A random sample can still receive a poorly worded question.
The AAPOR questionnaire principles call for neutral, clear questions. Keep that review separate from the evidence about how people entered the poll.
Worked check of an opt-in poll
Suppose a fictional transit agency wants feedback from all route users. A survey link is posted in a riders’ social group. Members can share it, and anyone who sees it can choose to reply. The report describes the replies as all riders’ views.
This example gives no counts or results. Use this five-stage trace to build an opt-in uncertainty note. The source facts show how people could enter. They leave open why people joined and how that choice affected the results.
| Stage | Fictional source statement | What remains to check |
|---|---|---|
| Target | All users of the route | Does the group include occasional riders? |
| Exposure | Link posted in a social group | Who saw it outside the group? |
| Entry | People chose to reply | Was choice linked to views of the service? |
| Comparison | No wider rider benchmark reported | How do respondents differ from all riders? |
| Claim | Replies presented as all riders’ views | Does the evidence support that scope? |
Table 1: This poll is fictional. A real trace should cite the invitation, methods and claim passages.
Keep rival motives open
People angry about delays may be keen to reply. Supporters worried about cuts may be just as keen. Both are plausible stories. Neither is a finding unless the study supplies evidence about why people joined and how that relates to their views.
Do not write “the poll overstates dissatisfaction” merely because entry was open. Pew’s original online-sample study found variation across samples and outcomes, rather than one universal pattern.
Correct the population claim
Replace “all riders think” with “people who chose to answer the posted poll reported.” Preserve the actual result only when the source supplies it. Add that the report gives no benchmark showing how these replies compare with all route users.
This change limits the claim; it does not prove that the answers are wrong. A paper-analysis workflow helps keep the reported result distinct from the group the authors use it to describe.
Test the evidence behind a remedy
More replies leave the entry route intact
A large open poll may give a stable account of the people who joined. It does not give missing people a known chance of selection. Before accepting a remedy, ask which part of the entry process it changes.
Probability sampling uses known nonzero selection chances from a frame; they need not all be equal. AAPOR’s method definitions provide a stronger basis for this distinction than a blanket “random versus voluntary” label.
Demographic matching needs further checks
Age or sex quotas may align those margins with a target group. People within each category can still differ on the question being asked. Matching age does not show that a poll captures the views of riders who never saw the link.
Pew’s benchmark findings show why a match on age or sex alone does not prove that estimates are sound. Its results come from a dated study. They do not rank today’s survey providers.
Weighting depends on data and assumptions
Weighting can help when its assumptions hold, but “we weighted the replies” is not enough. Ask which traits were used, where the benchmarks came from and how the team checked its estimates. Save those facts and the authors’ stated limits in the source note.
Use multi-source synthesis to compare the report with its methods appendix. If the data or model details are missing, keep the claim open. A qualified analyst still needs to judge whether the estimates are sound.
Save an uncertainty note in Atlas
- Add the invitation text, survey methods and reported limitations to one project. Include any benchmark report the authors actually used. Identify which sources concern the same poll.
- In Ask a question, use @ to select those sources. Ask: “Trace who could see the invitation and who could choose to reply. Compare the stated target with the respondent group. Cite facts and mark missing comparison evidence.”
- Open each citation and read the surrounding text. Check whether it supports the entry rule or only says how many people replied. Ask for separate source support when an answer combines these facts.
- Correct motive claims the sources do not establish. In the transit example, keep angry riders and supportive riders as rival possibilities. Narrow the all-riders statement to those who replied.
- Select New → Note and title it with the poll and survey period. Enter the entry trace, checked claim and unanswered questions, then wait for Saved. Revise the note when new evidence arrives.
The screenshot shows source text beside a cited answer. Read the source to check whether an answer’s interpretation is supported. Its visible AI paper is unrelated to the transit poll; the image illustrates the source-checking step only.
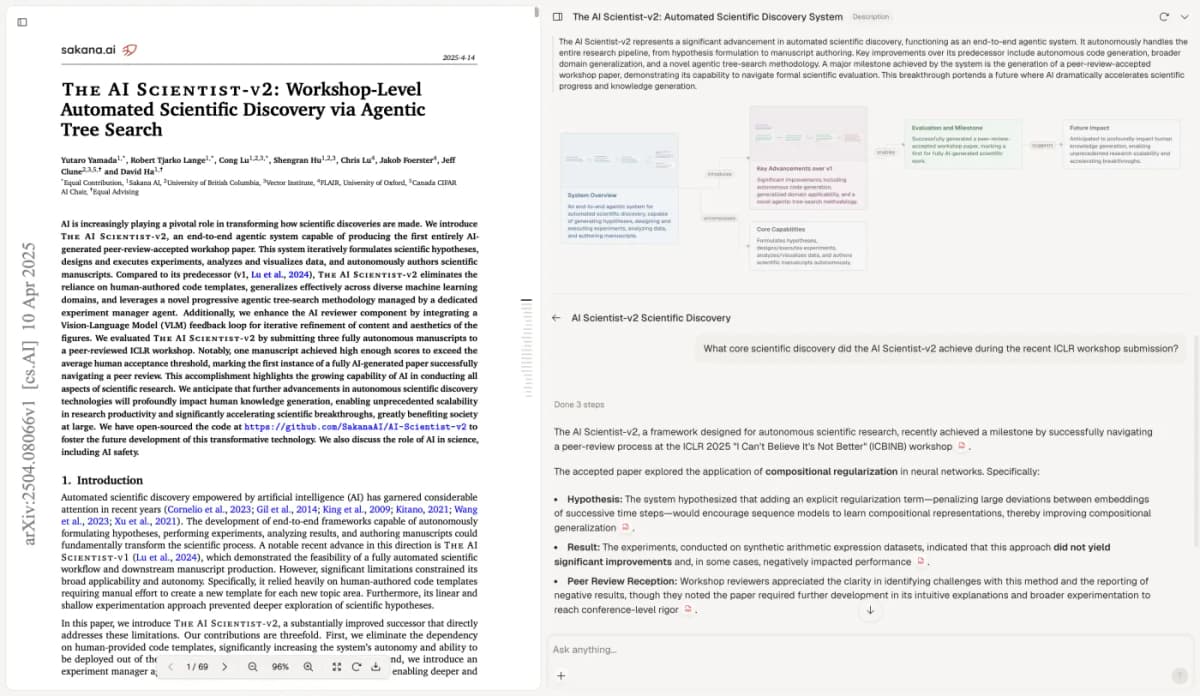
Use cited text to check a claim about entry; do not infer respondents’ motives from a label. Visible paper: The AI Scientist-v2, Yamada and colleagues, CC BY 4.0. Screenshot copied unchanged.
The note supports review of supplied documents. Researchers still judge the method and choose any remedy. For several studies, a literature-review process keeps each recruitment route and outcome distinct.
Report what the poll can support
State who chose to reply, where the invitation appeared and what comparison evidence is missing. Preserve the authors’ own limitations. Ask for recruitment details before treating a broad claim as an estimate for everyone in the target group.
For a quick recognition example, Statology’s open radio poll illustrates self-selection. Apply the same entry question to the actual report, while leaving bias direction and size for evidence to establish.
Trace who chose to take part
Compare opt-in recruitment with the population named in the claim.