

A market research report template is an outline for explaining a market question, the sources and methods used, the findings, and what the team may do next. Fill it from checked material, with a source location beside each claim that matters.
A broad count of businesses might belong in the market-context section. It cannot become a sales forecast simply because you move it under market size. Readers need to know what was counted and how that group relates to the people who might buy your offer.
Below is a reusable 9-part outline and a worked source map for a fictional service. Atlas can help organize supplied sources and method notes into that structure. You check the claims, preserve gaps, and save the reviewed report outline.

Build your report outline in Atlas
Organize supplied findings and check each claim against its source.
What the market research report template does
The report helps a reader weigh a choice by explaining the question, who or what was studied, how you reached the findings, and what remains unclear. Keep source links beside those findings so a reviewer can follow the reasoning.
A research plan states what you intend to do. A questionnaire gathers answers. The report explains the work done and what it supports. A business plan covers wider choices about how to run the firm and may draw on this report.
The SBA's market research guidance covers demand, place, other offers, and price. Choose the parts that matter to your decision. You need not fill every topic when the source pack answers a narrower question.
Adapt the outline to the reader and sources. A short price review may need less background than an entry into a new region. Keep a clear method note and source trail even when the main report is brief.
Prepare the question and source pack
Fix the decision and scope
Write the choice the report will inform, who owns it, and when it is due. Define the offer, customer group, place, and period.
Our research objectives guide helps turn a broad topic into a question the source pack can answer. Keep that question with the report so readers know what it is meant to resolve.
For example, a fictional team might ask whether it has enough evidence to test appointment reminders with independent repair shops. That is narrower than declaring the whole repair market attractive. A test decision and a launch decision need different evidence.
Keep a source register
Give each source an ID and record its author, title, date, source location, and permitted use. Keep the period measured separate from the dates of release and access.
A page updated this month may still report data collected years ago. Use the measured period when judging whether its findings fit the report's time frame, and retain the other dates for the source trail.
As you record each source's contribution, check who it covers. Qualtrics separates the target audience from the sample, a distinction that matters when the people you hope to reach differ from those whose views are in the file.
Mark what has been checked
Keep checked findings apart from draft readings and assumptions. With a price, record its currency, period, terms, and date. For interview findings, keep the passages and the method note explaining who took part.
When sources disagree, record why before choosing one number. Our market research challenges guide explains how scope and terms can cause apparent conflict. Keep an unresolved mismatch as a limit or next check.
Use this 9-part report outline
Use these headings as a starting point for your own note or document. Fill the evidence sections first, then write the summary. Keep only sections that serve the question, and state when a needed part has no usable evidence.
1. Executive summary
State the question, main finding, proposed next step, and largest gap. Write this last so its wording matches the checked report. SurveyMonkey's report guide puts the reader's decision first. That decision may be to wait for more evidence.
2. Question and market scope
Name the offer, buyer, place, period, and choice. Explain what you left out and why it matters. For a shop-reminder service, keep independent shops apart from chains and name who uses the tool as well as who pays for it.
3. Methods and source coverage
Describe the work done: which sources you chose, when and how you reached people, what you asked, and how you read the data. Link the full method note. AAPOR's disclosure standards are a useful reference for reporting survey and interview methods.
4. Market context and size evidence
Give background measures with their units and limits, and show the inputs, filters, assumptions, and sums behind an estimate. ONS distinguishes enterprises from local units, whose counts differ even before you ask who might buy.
5. Customer or audience findings
Describe needs, buying roles, and limits shown in the research. Keep sample details and cases that challenge the pattern. A few owners asking for easier booking records may give a reason to ask more, while leaving price and wider demand open.
6. Alternatives and competition
Compare rivals and current ways of doing the job on common terms, with dates and unknowns visible. The competitive landscape analysis guide helps build this part's source table. A page's silence about a feature does not prove that the firm lacks it.
7. Findings and interpretation
Answer each question with its source text, meaning, and limit. Keep what was recorded apart from what you infer. Place opposing cases beside the claim they affect so the main report shows the pattern fairly, with its caveats in view.
8. Recommendation and next checks
Name the next step your findings support and the terms it depends on. State who owns it and what would change the choice. When demand is untested, propose a study or a pause and explain why that is the right step.
9. Sources and appendices
Keep the full register, method records, questions, sums, and source passages here, with access suited to the data. Link main findings to the right items. AAPOR's transparency initiative promotes disclosure while leaving study quality for readers to judge.
Make the methods and evidence limits clear
Report what was done
Write what you did rather than copying the planned method. If a plan called for a survey but the pack has only interviews, say so. Writing the planned sample size in the method section does not supply the missing survey results.
For each study, record who took part, how they were reached, dates, questions, and who was left out. AAPOR's original standards cover these areas. Give readers enough detail to judge fit; clear records alone do not make the study sound.
Keep source methods separate
A company page, a business register, and an interview note have different purposes. Keep their methods and units distinct in the report. A rival's page records what it offers, but does not show what buyers prefer.
The SBA distinguishes existing information from direct research. Published sources can answer some broad questions while leaving specific ones open. Use the pack for the questions it can answer and state what else is needed.
Explain processing and limits
State how you grouped comments, handled repeats, checked values, or combined sources. Keep any filter with its result. Explain whether a count covers all records, those that met a rule, or just people who answered one question.
Describe missing groups and method changes. AAPOR addresses non-probability survey precision by requiring a stated, supported model for such measures. A familiar margin of error does not fit every set of feedback.
A worked question-to-report source map
Imagine a fictional team considering an appointment reminder service for independent repair shops. Its supplied pack contains a brief B1, interview summary I1, competitor-listing extract C1, method note M1, and internal decision note D1. All these inputs and findings are invented teaching material.
B1 defines independent shops in a chosen region as the intended audience. I1 describes owners asking for less manual follow-up, along with an owner who prefers the existing phone routine. M1 says the owners came from the team's contacts and were asked about their current work, without a purchase test.
C1 records two fictional rival offers whose listed prices use different billing terms. D1 states that the team can consider a small test but has not checked its support costs. There are no sales results, representative survey, or validated market estimate in this pack.
The source map below shows where those inputs belong and what each can establish. A source location in a real report would point to the exact page, paragraph, question, or table. These fictional IDs demonstrate the structure without claiming research occurred.
| Report question | Supplied fictional evidence | Where it belongs | Claim or gap to retain |
|---|---|---|---|
| Who is the offer for? | B1 scope names independent repair shops in the selected region. | Question and market scope | Intended audience is defined; its size is not yet established. |
| What need appears in the accounts? | I1 has requests for less manual follow-up and a preference for phone calls. | Audience findings | Some supplied accounts support exploring reminders; retain the opposing preference. |
| How were those accounts obtained? | M1 describes recruitment through team contacts and questions about current work. | Methods and limits | Contact-based accounts do not establish population demand or actual buying. |
| Are rival prices comparable? | C1 lists offers with different billing periods and terms. | Alternatives and competition | Normalize terms and check inclusions before claiming one is cheaper. |
| What next step is justified? | D1 permits considering a small test but leaves support costs unchecked. | Recommendation and next checks | Explore a scoped test after checking constraints; no profitable launch is established. |
Table 1: Fictional source map: each row connects a question to evidence, a report section, and a bounded claim. The IDs refer to invented teaching inputs, not real documents or Atlas results.
A weak summary might claim that shops want the service and that the lowest listed rival price sets the right price. Neither claim follows. The accounts do not test buying, and the listings have not been compared on common terms.
A better report states that supplied accounts suggest a follow-up need worth exploring, with an opposing case and a limited recruitment base. It assigns price-term and support-cost checks before a test decision. The SBA's pricing and alternatives questions help frame those checks without supplying their answers.
Keep the map as an assembly aid rather than a new layer of evidence. Moving I1 into the audience section does not strengthen the interviews. A colleague should be able to challenge the wording by opening I1 and M1, then revise the finding and its limit together.
Check a market chart before using it
The original ONS figure below reports UK businesses registered for Value Added Tax or Pay As You Earn from 2020 to 2025. It is a historical source example for this guide. Its title, years, unit, and source line show what needs to travel with a chart in a report.
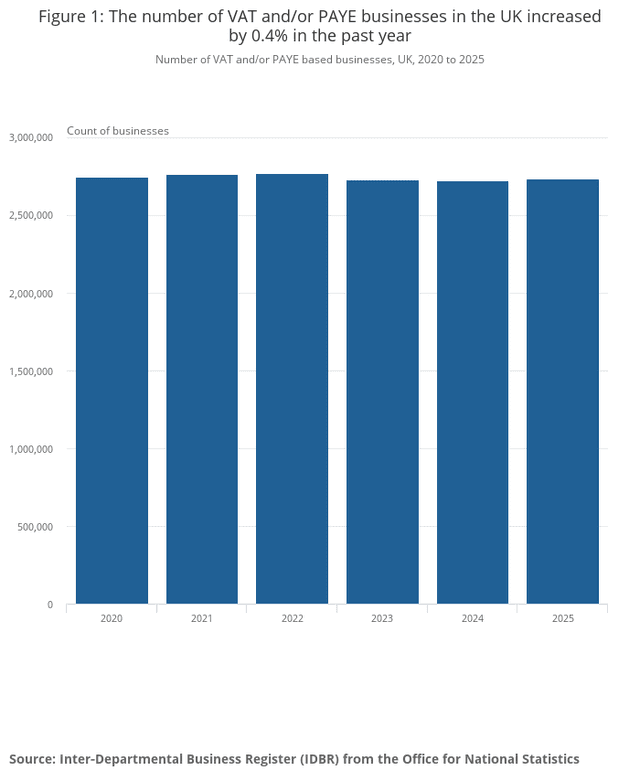
Office for National Statistics, UK business; activity, size and location: 2025, Figure 1. Complete unchanged chart under the Open Government Licence v3.0. Historical registered-business counts are not likely-buyer counts.
The figure covers registered businesses across the UK. The fictional question concerns independent repair shops in one region. The chart does not show whether those shops need a reminder tool, can be reached, or will pay for one.
ONS's quality and methodology information explains which businesses its register leaves out, including some small firms without employees. Check who a source covers before using its count as a base for your market estimate.
The chart counts enterprises rather than every shop site. One enterprise can have several sites. For a tool sold per shop, that difference changes the unit you need, while leaving buyer demand as a separate question.
For a size estimate, show how you chose the industry, region, buyer rules, and other filters. Leave demand that has not been measured as an open question.
A broad count times a guessed price gives a number based on those inputs. It does not show sales you can expect. Keep both the assumptions and the missing tests visible rather than giving the result a forecast label.
Keep definition changes beside trend claims. The 2025 ONS bulletin explains changed register treatment for some pension schemes. A change in who is counted can move a total without changing demand.
Write a recommendation that fits the findings
Put the supported answer first
After checking the source map, write a short answer that preserves its scope. For the fictional pack, the owners' accounts suggest a need to explore less manual follow-up.
Keep the preference for phone calls and the contact-based recruitment limit beside that finding. A short summary should still show what stops the claim from extending to all shops.
Then explain why the answer matters to the choice. SurveyMonkey's report guide puts the reader's decision first. Make the next step clear while preserving the gap between exploring an idea and deciding to launch.
State what still needs checking
Name the gap, the check it needs, and the person who owns it. In this example, the team must compare rival billing terms and assess support constraints. Testing actual interest in a defined offer would answer a different question from asking about current routines.
Label estimates and assumptions in the summary as well as the appendix. Our market research challenges guide discusses gaps and conflicting sources.
Keep any limit that could change the choice in the short version. If the summary drops the recruitment caveat, a reader may think the owners' views apply to a group the study never reached.
Choose a proportionate next step
Propose a scoped test, more research, a pause, or another step that fits the findings and constraints. Say what would cause the team to reconsider. A report can give a useful answer even when the next step is to wait.
Review the final wording with someone who knows the pack. AAPOR's transparency initiative supports disclosure without judging method quality. A source trail lets your team check the claims and decide whether the findings are enough.
Organize the checked report in Atlas
Select the source pack
Use only files and findings you may process in the tool. Prepare the brief, sources, method notes, and checked findings, leaving out restricted details as required.
Name the exact question and report scope before asking for an outline. The brief should help the response stay focused on the choice the team needs to make, rather than a general account of the industry.
In project chat, use @ to mention the files. Choose Project only to block new web and literature searches. Earlier chat context stays available, so check it or start a fresh chat when outside sources could blur this task.
Ask for sections and supporting passages
Request an outline from the named pack, with a source location beside each proposed finding. Ask it to keep facts, readings, assumptions, limits, and next steps distinct.
Ask the draft to mark absent evidence as a gap and avoid inventing a market-size number. A section with an open question is more useful than a filled section whose claim has no source.
Compare the draft with the five-row map. A passage from M1 belongs with the recruitment limit, while D1 supports a constraint on the decision. If the response mixes them into a broad market claim, ask it to separate each source's contribution.
Inspect, correct, and save
Open numbered citations and read the surrounding passages. Check names, dates, units, and conditions; a source link alone does not prove the wording is right. If a citation does not open, find the item by name and check the original text.
Correct demand claims, price terms, and missing opposing cases yourself. Keep the checked outline in a note through New, then Note, and wait for Saved. Atlas helps organize and review sources; saving the note does not certify its claims or next steps.
Review and hand off the report
Have a reviewer trace the summary and key findings to the sources. Check that actual methods, sample limits, units, calculations, and open questions remain visible. Ensure the audience may access the material you share, especially any private research appendix.
Share the report with a clear next-step owner and review date. When a new source changes the answer, update the finding, summary, and recommendation together. Keep enough of the source trail for the next reviewer to understand why the decision changed.
Build your report outline in Atlas
Organize supplied findings and check each claim against its source.