

A ceiling effect is a problem near the top of a score scale. Scores reach or bunch near its highest point, so the test struggles to tell high scorers apart or show more change. That top score may fall short of what a person can do.
When reading a paper, connect the score bound, the scores in the report, and the claim they support. A high mean does not reveal each person's result. Keep the gaps visible in your note.

Check the score limits in your sources
Compare scale bounds with reported results and author limitations.
What the ceiling effect means
An eight-point test has eight items worth one point each. A person who gets all items right earns eight points. Someone who could solve much harder items also earns eight. The score shows success on these items, but cannot tell their skills apart beyond the test's range.
Wang and colleagues' original methods study separates this score limit from a true performance plateau. A plateau concerns what a person can actually achieve; a ceiling concerns what the measure can show. Neither establishes the other.
A floor effect is the reverse problem: it is hard to tell scores apart near the lowest point. Keep the score direction clear, too. A high number might mean more symptoms rather than better skills.
This guide concerns score bounds. The term also has a use for drug effects, as the Scribbr definition explains. That dose-response meaning calls for a different kind of evidence.
Trace the boundary through 4 source checks
Start with the instrument description and the study's results. Then read the discussion for the authors' account of the limit. A scale name is not enough if the study used a different version or a particular subscale.
| Check | Passage to find | What to preserve |
|---|---|---|
| Scale identity | Instrument version, subscale, and scoring rules | Which score the paper actually used |
| Boundary | Maximum possible score and its meaning | Upper bound and score direction |
| Reported concentration | Counts, distributions, or author descriptions | Exactly what was reported at or near the bound |
| Interpretation | Explanation of limited distinctions or change | Which conclusion the measure may not support |
Table 1: Four source checks connect a score boundary to the authors' reported restriction.
Keep “at the top” apart from “near the top.” A report can describe either, but they are not the same count. If the authors group high scores, keep that group rather than label them all as top scorers.
The intended comparison matters. Ho and Yu's original measurement research treats ceiling effects in terms of the precision needed to distinguish high scores. Record whether the study wants to compare people, groups, or change over time.
If the source gives only a mean, write that down. Do not guess the share of people at the top. The Statology income example shows why a broad top category can hide the values within it.
In a broader research paper analysis, preserve that missing detail. The gap helps you decide which claims need more support.
A worked example at the top score
In this fictional teaching example, a workshop helps people identify archive catalog fields. Its quiz has eight items and a maximum of eight points. The imagined report says many participants scored eight before and after the workshop, but gives no count for that group.
A draft reading note says: “The workshop produced no learning because high scorers stayed at eight.” The supplied statement supports unchanged quiz scores for those people. It does not show whether they learned skills beyond the eight questions.
A corrected note reads: “The report says many people reached the quiz's top score before and after the workshop. Their scores had no room to rise. The sources do not settle whether they learned more. They also do not state what share of the group reached eight.”
That wording preserves the result while limiting the claim. It also avoids the reverse mistake: saying the workshop must have helped because the test had a ceiling. Hidden improvement is possible in this example, but it has not been shown.
Suppose an appendix later says people tried new catalog tasks. Read what those tasks tested before you revise the note. They may answer a new question while leaving the missing quiz scores unknown.
You can carry that distinction into research paper synthesis. Compare what each measure records before treating unchanged scores across papers as evidence of the same underlying result.
Why a high average is not enough
A high mean does not reveal how scores were spread. It might coexist with many maximum scores, or with varied scores below the maximum. The average alone cannot tell you how much useful distinction remains at the upper end.
Ho and Yu show why skewness alone is an unreliable shortcut. Their examples consider the spacing of score points and the distinctions users need. A chart's shape is a reason to investigate, not a complete measurement verdict.
For change over time, the concern can grow as more scores reach the top. Wang and colleagues tested models of change with simulated data and a real example. A ceiling can affect those estimates, but their work does not supply one model for all bounded scores.
If you are evaluating an existing report, retain its method and stated assumptions for expert review. Changing a scale or choosing an analysis method requires more evidence than a reading note provides. Do not rewrite the study's scores to make the pattern look more informative.
A useful limitations section links the score limit to a claim. “The quiz cannot show more gains for top scorers” explains the concern without rejecting all findings. Other score ranges or outcomes may still answer worthwhile questions.
Compare scale descriptions in Atlas
Put the scale guide, study results, and authors' account of the limits in one project. Use sources you have permission to add. The aim is to trace what the score can show; missing data stay missing.
- Use @ to select the relevant sources. Ask: “Trace the maximum score, its meaning, and the authors' description of scores at or near it. Separate the reported result from any claim about unmeasured improvement.”
- Open each citation and read its surrounding passage. Check that it refers to the same scale version, subscale, and time point. A citation about another outcome does not establish this score's boundary.
- If the answer supplies a percentage absent from the report, ask for its supporting passage. Remove the unsupported figure and keep the authors' own description. Do not substitute an estimate from another paper.
- Create a note using New → Note. Save the boundary, reported concentration, interpretation limit, correction, and unresolved question beside their citations. Check Saved before leaving.
These steps help you compare sources and save a checked note. They do not fill gaps in the data or prove that a scale suits a study. You judge whether the claim fits the source.
For a wider source set, the research synthesis workflow helps you keep each paper's score scale and study goal visible.
The Atlas view below shows a cited answer beside its source. Use that source panel to check the scale version and the reported score limit. The paper pictured concerns AI research; it supplies no evidence about the fictional quiz or ceiling effects.
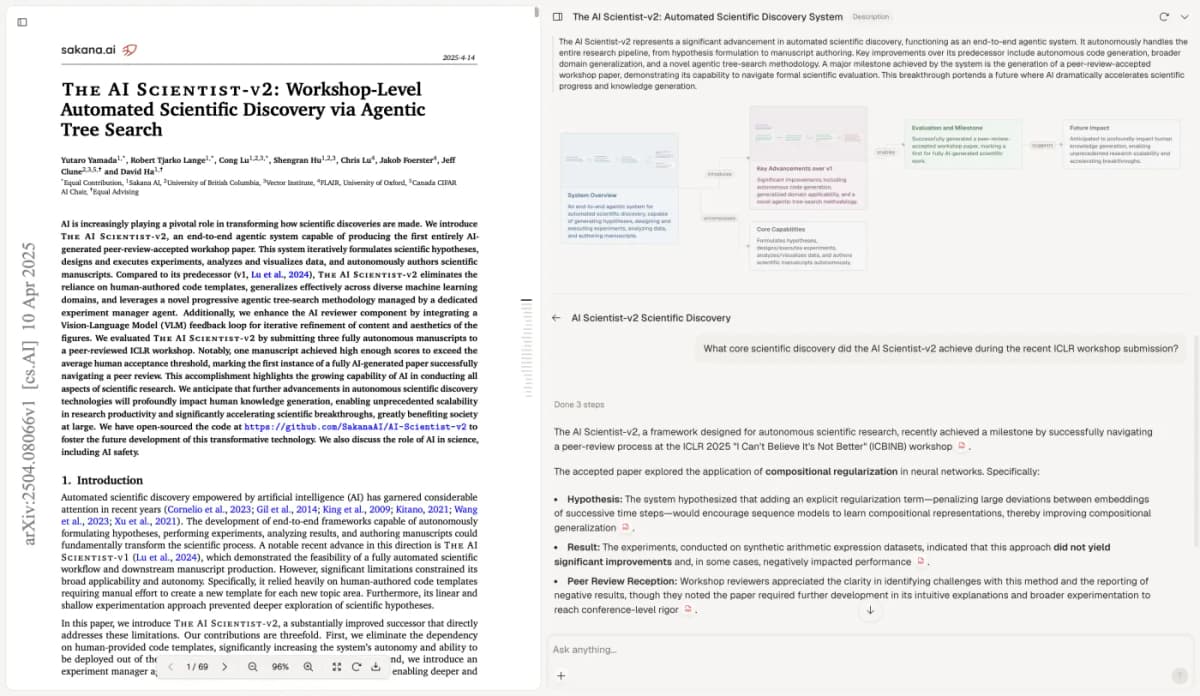
Read the source passage before accepting what an answer says about the result.
The visible paper is Yamada et al. (2025), licensed under CC BY 4.0. It appears within the unchanged Atlas capture.
Keep the result and the unknown separate
End the note with what the test shows and what it leaves unknown. A top score that stays the same is a result. Change beyond that score stays open unless a suitable source addresses it.
Keep enough context to revise the note when an appendix, scale guide, or author correction appears. In a literature review, this lets you update one claim while keeping the rest of the reading intact.
Check the score limits in your sources
Compare scale bounds with reported results and author limitations.