

Industry analysis studies how a defined industry works: who takes part, what shapes demand and costs, how firms compete and what could change. A useful brief gives each finding a source and a limit, so a reader can check the grounds for a decision.
Start with a clear question and dated reports. Then build a brief that keeps facts, company claims and your own reading apart. The worked example below shows how three files can inform a decision while leaving key questions open.

Check your industry brief against its sources
Compare industry findings with dated reports and keep evidence limits visible.
Define the industry and the decision
Write the decision before you gather more reports. A team weighing a new service needs different facts from a student describing how firms compete. Name the product or service, place, buyer group and time span that your question concerns.
CFA Institute's guide starts by defining the industry and notes the limits of systems used to group firms. Make those choices clear in your brief. A report on all building services may offer background for a study of one repair service. Its total sales would still cover more than that service.
For a teaching example, suppose your question is whether to study demand for repairs to small business buildings in Region A. You want to review the last full year's reports before you decide to speak with buyers. Region A and the files used below are fictional. They make no claim about a real market's growth or appeal.
Record what your scope leaves out, since firms that make tools and firms that use them can appear in the same trade report while belonging to different data groups. Widening the scope may change what earlier totals mean, so check those figures and comparisons again.
Check what each report actually measures
Read the classification levels
Read the source's terms before you copy a number. NAICS groups business sites by similar ways of producing goods or services. Those groups support official statistics. They may differ from the set of options a buyer would consider. One company can also have sites that carry out different kinds of work.
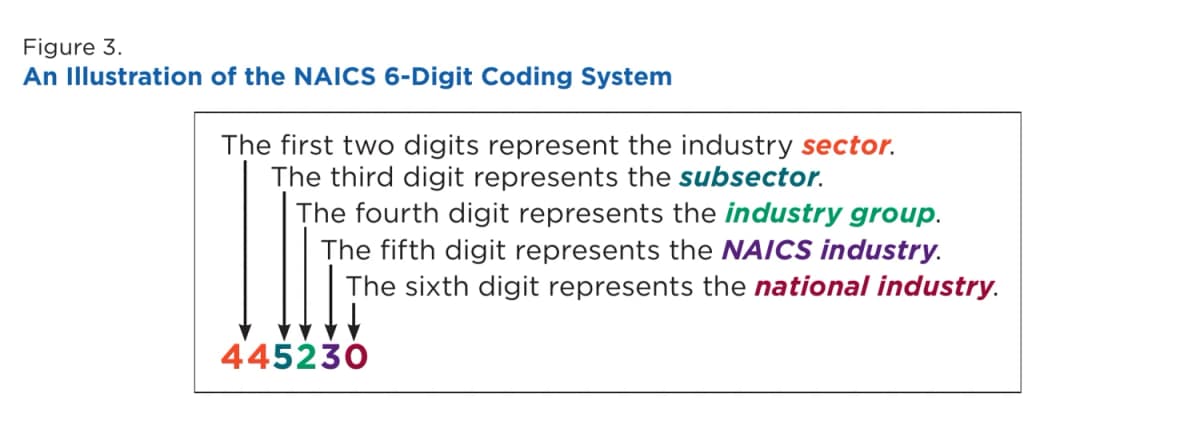
The U.S. Census Bureau's Recent Changes in Census Industry and Occupation Classification Systems shows this hierarchy in Figure 3, printed page 9. The 2020 report uses a 2017 code to explain the system's levels. Check the current release when choosing a code.
The figure narrows the group as you read the code from left to right. The first two digits identify the sector, followed by the subsector at three digits and the industry group at four. Five digits identify the NAICS industry, while all six specify the national industry.
The figure helps you ask whether two totals refer to the same level. For code definitions, use the 2022 NAICS manual and check release details on the Census site.
Keep source definitions with totals
Keep each report's author, publication date, data period, place and included activities in a source note with the unit and page or table number. Publication and data dates matter separately because a new report can use old data. The unit also bounds the claim: sales, shipment value, jobs and counts of sites tell you different things.
When two reports give different totals, compare these notes first. One may cover more places or more kinds of work. Both totals could be correct within their own scope. Keep them apart until the definitions and methods support a comparison.
Appinio's guide describes gathering data about the market, firms and wider conditions. For your packet, ask which file can answer each question. Recent files can still leave you short of the facts needed for your decision.
Use frameworks to organize evidence
Ask about competitive forces
Choose a method that helps you ask useful questions. Porter's Five Forces looks at rivalry, new entrants, substitutes, buyer power and supplier power.
It helps you look beyond named rivals to the forces that shape profits across an industry.
Turn each force into a question about the barriers new firms face, the availability of needed parts, or the alternatives buyers could use. Keep a source and a limit beside each answer. A firm's claim that buyers value its service records its own view without establishing how hard switching is across the market.
Track wider changes
CFI's methods guide also covers wider forces and SWOT. PESTLE groups political, economic, social, technological, legal and environmental factors. SWOT groups strengths, weaknesses, opportunities and threats.
Work through the labels by asking which rules could change costs and which skills belong to a particular firm. Keep firm-specific skills apart from conditions that affect the whole industry.
For a possible driver, explain how it could work. If parts take longer to arrive, a repair firm may struggle to keep its schedule. Check for evidence of the delay and of its effect on work. Until you find both, keep the link as a reasoned possibility in your brief.
For uncertain changes that may matter later, horizon scanning helps record the signal, its source, and what would confirm or weaken it.
Creately's guide describes several ways to study firms and trends. You can choose one without filling every grid. Two well-supported findings and a clear open question can help more than a full chart of guesses.
When your next question is about choices open to a buyer, use a competitive landscape analysis. It can add detail to the brief's work on rivals and substitutes. Define that comparison on its own terms, including which buyer and need it covers.
Build an industry-driver-competitor-risk brief
This packet is fictional. Its files, pages and findings are teaching examples, with no real market estimates or product results.
The fictional packet contains Regional Services Report for Region A in Year 1 and Company C Annual Report for that firm's Year 2. A third file, Draft Service Policy, describes a proposed rule whose status still needs checking.
Use the packet to review the earlier question about repair work. Each row keeps the source claim apart from a broader claim you might want to make.
| Brief part | Source and location in the fictional packet | What the source supports | Next check |
|---|---|---|---|
| Industry scope | Regional Services Report, terms on page 2 | The total includes repairs and installation across Region A. | Find a repairs-only breakdown before using that total for the service in your question. |
| Driver | Regional Services Report, supplier section on page 7 | Firms interviewed describe delays getting parts in Year 1. | Check who took part and whether delays persist in the period you need. |
| Competitor | Company C Annual Report, service section on page 12 | Company C reports adding repair contracts in Year 2. | Check what counts as a contract. The firm's growth alone cannot measure industry growth. |
| Risk | Draft Service Policy, scope in section 4 | The proposal would cover some service work if adopted. | Verify its place, status and scope before treating it as a rule firms must follow. |
Table 1: The first row shows that the report's group is wider than your question. Leave its total out of a repairs-only estimate. The driver row gives a possible constraint, tied to a time and a set of firms. It cannot tell you whether all firms face the delay now.
The competitor row keeps the company's own account. Investor.gov's 10-K guide explains that the company prepares the filing and the SEC does not vouch for its accuracy.
The business and risk sections can help you understand what a firm reports. Read them with care, keeping reported facts apart from the firm's outlook.
For the risk row, read the original policy file as well as any summary of it. A draft can still change or fail to take effect. Ask a qualified reviewer to check real questions about what a rule covers and who must follow it.
A checked conclusion could say that the sources raise two questions for further study: parts supply and a possible rule change. They give no repairs-only industry total and do not establish current demand among the target buyers. The next step is to seek that missing evidence before judging the case for expansion.
Keep comparisons and uncertainty visible
Compare matching measures
To calculate market share, the firm figure and industry total must cover the same activity, place, period and unit. Matching headings alone do not establish that fit. If the measures differ, retain their labels and explain why they cannot yet support a share.
Use the same care with growth. A larger total could reflect a wider scope, a changed definition or price rises. Read the method and table notes before calling it growth in the amount of work done.
WallStreetMojo's guide stresses reviewing available reports and narrowing the industry. Your source notes let a reader check how you did that.
Keep forecasts labeled as forecasts, with their assumptions. A report may predict higher sales next year, but those sales have yet to happen. If two forecasts differ, compare their starting points and conditions before choosing a figure.
Label what each claim represents
Use four plain labels in your brief. A reported observation gives a fact from a source. A company statement records the firm's claim or view. An analyst interpretation gives your own reading and reasons. An unresolved question names what you still need to find.
Add locations to the source claims and reasons to your reading. The primary and secondary source distinction helps identify whose account each passage gives. A filing records the company's statements, while another analyst's summary adds a separate reading to check.
Missing evidence in your packet cannot prove an opening in the market. If you have no buyer interviews, you cannot conclude that buyers have unmet needs. You may need a better report, more files or new research.
Our guide to market research challenges helps you think through barriers to that next step.
Compare the selected sources in Atlas
Bring the processed reports and your draft brief into Atlas. Mention the named files with @ in a grounded question. Ask which passages support each row, where the files differ in period or scope and which claims they leave unsupported.
Compare what each selected file adds. Ask for source claims and your own inferences to stay distinct. A cited answer gives you text to review. You still need to judge whether the packet covers enough of the industry for your question.
Open each citation to check table notes, dates and limits on company claims in their source context. When a citation lacks a clear location, find the passage in the original file before deciding whether its finding belongs in the brief.
Correct the brief after you review the sources. Choose New, create a Note and wait for Saved. Keep the findings, source locations and open questions together. A later reader should see which gaps still block the decision.
For longer files, the habits in how to synthesize research papers also help. Keep sources distinct while showing where they agree, differ or answer separate questions.
Atlas supports this comparison of files. You own the checks on market data and policy status, and the final decision.
Review the brief before using it
Read the conclusion against your first question. Can a reader see the activity, place and period? Can they open the source for each main finding? Check that every total keeps its unit and every forecast keeps its assumptions.
Review the claims about competition too. Harvard's Five Forces guide covers forces beyond current rivals. If your brief lists firms but leaves out buyers, suppliers or substitutes, decide whether those gaps matter.
Check which version of a data group you used. The Census classification site gives release details. The report itself tells you which version its data uses. Keep both facts when you compare figures from different years.
End with a step that follows from the evidence. You might seek a narrower breakdown, check a policy's status or test demand with target buyers. If the packet cannot support a decision yet, state what is missing and how to find it. A useful brief makes both its findings and its next step easy to review.
Check your industry brief against its sources
Compare industry findings with dated reports and keep evidence limits visible.