

Quantitative research design is a plan for answering a question with numbers. It sets out who or what you study, what you measure, and how you compare the results. A survey form or a statistical test is only one part of that plan.
Start with the claim you need to make. Do you want to describe a group, find a link between two measures, predict an outcome, or learn whether a change caused an effect? The answer helps you shortlist designs before you choose tools.
This guide uses a fictional writing workshop to show how a plan changes when you cannot assign groups at random. Use it to build a source-checked note for you and a statistician to review. No data or findings were created for the example.

Check the assumptions behind your design
Compare design guidance with your question and constraints.
Start with the claim you need
Write the question before choosing a design name. “How many students use the writing center?” asks for a count. “Is attendance linked to later writing scores?” asks about a relationship. “Does offering a workshop improve scores?” asks whether a change has an effect. Each needs its own comparison and supports a different claim.
A prediction question asks how well known inputs forecast an outcome in new cases. It does not tell you what would happen if you changed one input. Keep the intended claim in view so an easy-to-get dataset does not quietly change the question.
Curtin’s study-design guide separates studies that observe from those that intervene. Both need a plan for who takes part, when measures are taken, and what could bias the result.
NIST’s design guidance begins with the study goal and variables before choosing an experiment.
Compare quantitative design options
Design labels cover several parts of a study. “Descriptive” names a goal; “cross-sectional” means a snapshot; “randomized” describes how groups are formed. One study can carry more than one label. GCU’s overview uses common learner categories, but your plan should say what happens in the study.
Use this table to shortlist options, then check each source against your own question and setting.
| Option | Question it can help address | Evidence and assumption to review |
|---|---|---|
| Cross-sectional study | What do we measure in a group at one time, and which measures are linked? | Curtin’s snapshot guide: check who responds. Measures taken together do not show which came first. |
| Cohort study | How do outcomes develop over time in a defined group? | Mann’s review: check when exposure and outcome occur, other group differences, and who is lost to follow-up. |
| Case-control study | Which past exposures differ between people with and without an outcome? | Mann’s design comparison: people enter based on outcome status. Check the controls and records of past exposure. |
| Randomized experiment | What is the effect of assigning a change compared with a stated alternative? | NIST’s randomized design: define the unit assigned, the random process, how outcomes are measured, and how you handle changes to the plan. |
| Quasi-experimental study | Can a nonrandom comparison help answer an effect question? | Handley and colleagues’ review: justify the comparison group or period. Check how groups were formed, other events, and changes in the measures. |
Table 1: Design shortlist: each option needs a clear question and checks; this is not a universal ranking.
Separate timing from assignment
A longitudinal study follows change over time. That alone does not make it an experiment. A cohort can use new measures or past records; an experiment can also track people over time. State both the timing and how groups are formed.
A survey collects data within a study's design. You could ask the same questions once or return to the same people later. Asking a fresh sample each time tells you about group change, while following the same people lets you study their change. The Curtin toolkit separates these time structures.
If interview accounts also need to explain a pattern in the numbers, the mixed methods research design guide helps plan where the two kinds of evidence will meet.
Separate sampling from assignment
Random sampling concerns who you select from a population. Random assignment concerns which study units get each condition. Volunteers can be assigned at random, but that does not make them a fair sample of everyone. Describe both steps rather than using “random” as a badge of quality.
Keep the outcome clear too. NIST’s guide to choosing variables asks a team to identify relevant inputs and responses before running a study. In your field, explain what the measure means and how it captures the idea you want to study.
Worked design choice for a workshop
Suppose a university wants to study a new writing workshop. This is a fictional plan, with no data or findings. The question is: “What is the effect of offering the workshop, compared with usual support, on a writing score four weeks later?”
Use a common scoring rubric and the same assessment conditions for both groups. Compare the effect of offering the workshop, including students who decline or miss sessions. Attendance may vary after the offer. State that choice now so the question and comparison stay aligned.
When assignment is available
If the school permits it and the plan is feasible, you could assign eligible students at random to an offer or usual support. Record how this will happen, how you will assess their work, and how you will follow both groups. NIST describes random assignment to study units; a statistician should help adapt the plan to this setting.
If whole classes get the offer, the class is the unit assigned. Students in a class share conditions, so you cannot treat them as if each was assigned on their own. Bring the number of classes and likely within-class similarity to the planning meeting rather than guessing a sample size.
If the intervention is tested during normal classes, use the field experiment guide to check the setting, delivery, and comparison. A real-world setting does not by itself make groups comparable or show that a finding applies elsewhere.
When assignment is unavailable
Now suppose one campus gets the workshop and another keeps usual support. The groups were not formed at random. Baseline and follow-up scores could help you compare them, but campus differences and other events could explain a later score gap.
The source figure below shows this structure. Both groups are measured before and after, while only one gets the intervention. Handley and colleagues explain why that comparison group remains non-equivalent: it may differ from the other group in ways that matter. The diagram illustrates a study design; the fictional workshop has no results.
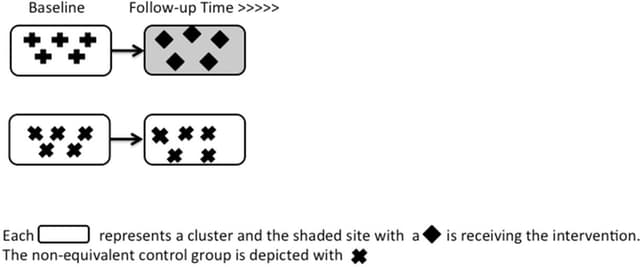
Figure 1 by Handley, Lyles, McCulloch, and Cattamanchi (2018), reused unchanged under CC BY 4.0: both groups are measured at baseline and follow-up.
Ask whether the campuses use the same rubric, admit similar students, and face other changes during the study. If you have too few comparable units or no useful baseline records, you may not be able to answer the effect question. You can still describe the score gap and state that limit.
A time-based option would need repeated observations around a clear start date. An interrupted time series needs checks for prior trends, seasonal changes, and other events. One score before and one after is not a time series. Review the design’s fit before choosing a test.
Record assumptions before choosing
For each option, write down what must hold, what evidence you have, and what is still unknown. A list of design names cannot do this work for you. A note with those three parts gives a specialist something concrete to review.
Ask what else explains the difference
Confounding means another factor helps explain both the group or exposure and the outcome. In the workshop example, students who seek extra support may have different prior skills or drive. A score gap between those who attend and those who do not may reflect those differences.
An unchecked note might say, “The workshop improved writing because attendees scored higher.” A better planning note says, “Compare scores, but check prior differences and how students chose to attend before claiming an effect.” This repairs a proposed claim; it is not a result from a real study.
Check measurement and missing data
Use the same outcome definition and follow-up window for both groups. Note who may miss the final assessment and why. If each group loses a different mix of students, that can distort the result even when the initial groups were assigned at random.
A larger sample can give a more precise estimate. It cannot fix a biased measure or a weak comparison. A small p-value cannot fill that gap either. Keep two questions separate: how much could the estimate vary, and what does the design let you claim?
For education research, the What Works Clearinghouse resources list the current Version 5.0 handbook and reporting guides. Check the standards that apply to your study. This overview does not certify that your plan meets them, and other fields have their own requirements.
Compare design sources in Atlas
Atlas can help organize evidence for a provisional choice. Add permitted methods papers and a short document with your question, population, outcome, timing, and constraints.
A research paper analysis workflow helps you locate methods passages before comparing them.
Use these steps to build a planning note:
- Select the sources with
@. Mention the design papers and your question document. Ask for a comparison limited to those sources and your stated question. - Separate guidance from your proposal. Request columns for design option, source passage, assumption, fit to your question, and missing information. Check the proposed fit against your question and setting. The paper supplies guidance for that judgment.
- Ask how the comparison works. For an effect question, ask which group or period each source compares and what must hold. Do not ask Atlas to certify a causal claim from a design name.
- Open the citations. Read the methods passage and nearby limits. Correct claims that drop a condition or use guidance from another setting without explaining why it fits.
- Keep gaps visible. Mark missing baseline records, unknown follow-up loss, or unclear group assignment for review. If a source does not answer a question, keep the gap in the note.
- Save the checked note. Use
New → Note, add the corrected comparison and assumptions, and confirmSaved. Keep source references so you and the statistician can revise it together.
Try: “Using @Design Papers and @Study Question, compare options for this question. Cite the design features and assumptions. Separate what each paper says from your proposed fit, and mark what we still need to know before choosing.”
The research synthesis guide shows how to compare sources while keeping their differences clear.
A methods paper can support a design principle; your own records show whether the needed conditions exist. Atlas does not verify those conditions on its own or replace a power analysis.
Prepare the statistical planning handoff
Bring the proposed design, question, population, unit assigned, comparison, outcome measure, dates, and cited assumptions to the planning meeting. Include the constraints that ruled out other options.
Keep the sample size and analysis method open until the specialist has the inputs needed to assess them.
Discuss the smallest effect that would matter, likely score variation, loss to follow-up, and class or site grouping. Review access, consent, and ethics before collecting data. These details help determine whether the plan can work and what it could claim.
Keep the methods search bounded. A literature review process can help you track why a source matters and where it applies. Aim to leave the meeting with a revised plan and open questions, rather than treating the first table as final approval.
Check the assumptions behind your design
Compare design guidance with your question and constraints.