

Stratified sampling draws units within each stratum. Cluster sampling draws groups, then studies units only in the chosen groups. Ask which groups supply the sample. Schools, districts, and age bands can serve more than one role.
In a one-stage cluster sample, all units in each chosen group are included. A multistage design draws a further sample inside those groups. When reading a paper, keep the group draw and the person draw distinct.

Trace the sampling steps
Compare group definitions and selection rules against your study sources.
What changes between the designs
Stratified sampling uses strata. These are subgroups used to spread the sample across a whole group of interest. A team might split a student list by grade, then draw students within each grade. A cluster is a group drawn as a unit, such as a school.
In a cluster design, only chosen schools supply students. Statistics Canada's sampling guidance distinguishes those steps and explains sampling within clusters as a multistage design.
The mix inside a group can help explain why a design works well. Strata often group people alike on a trait that matters for the study. Clusters often follow real boundaries, such as places. Read the rule for drawing units as well as the group description.
Read the reported selection steps
Start with the group definition, then find the rule for drawing units.
Note which groups can supply people and whether the report describes a later draw inside those groups. If a step is missing, leave it open.
Compare groups and selection stages
Read the grouping and sample-draw passages together. These five checks help you decide which label fits a study.
| Feature | Stratified sampling | Cluster sampling |
|---|---|---|
| Which groups supply units | Each stratum | Chosen clusters |
| What gets drawn | Units within each stratum | Groups first; possibly units later |
| Common purpose | Cover subgroups and improve precision | Concentrate fieldwork or use group lists |
| Within-group selection | A specified rule for each stratum | Everyone in one-stage designs; a sample in multistage designs |
| Reading question | Was each stratum sampled? | Which groups and later units were selected? |
Table 1: The steps used to draw units define the design; group names alone do not.
A school can serve either purpose, as the official multistage examples show. A study that draws students within each school may treat schools as strata. A study that draws some schools at random first uses them as clusters.
If it splits schools by region before drawing schools, it combines the two designs.
One school population, three designs
Imagine four schools, each with students in two grade bands. The next three plans are fictional teaching examples. They use the same schools so you can see how each rule changes the sample.
Procedure A: Join the student lists, split them into two grade bands, and draw students at random within each band. Both bands supply the sample. The grade bands are strata; one school could still supply no students.
Procedure B: Draw two of the four schools at random, then survey all students who meet the study rules in those schools. Schools are clusters. Neither of the other schools supplies students, even if their students differ from those in the chosen schools.
Procedure C: Split the schools into two regions, draw a school at random within each region, then draw students at random within each chosen school. Regions are strata, schools are first-stage clusters, and students are selected at the second stage.
Procedure C is a stratified two-stage cluster design. Calling it only stratified hides the school draw. Calling it only cluster sampling hides the fact that both regions supply a school. A useful note states the role of each group.
Now suppose a methods section says only that two schools were drawn at random. That supports a cluster-selection step.
It does not tell you whether all students, a student sample, or volunteers gave answers. Keep the within-school rule as an open question.
The MacEwan sampling chapter also shows how a sample can be drawn within groups. A group label can describe only part of a design.
Match the design to the question
The subgroup guidance from Statistics Canada explains why you might choose a stratified design when the study needs a result for each subgroup. Drawing within each subgroup gives it data to use. Sample size still matters; a small draw in one group may leave wide margins of error.
The same cluster guidance explains how a cluster design can cut travel costs by keeping fieldwork in fewer places. People in the same place may share traits that affect their answers. Adding more people there can yield less new evidence than reaching more places. The value of reaching more places depends on the study question, shared traits, and how the sample is drawn.
Choose a cluster design when field costs and available group lists favor it. Check the effect of shared traits within groups before deciding how many places to reach.
The sizes of the groups also matter. Drawing equal numbers from unequal strata changes the sample's mix. An overall result may need weights based on each person's chance of being drawn.
Probability sampling guidance requires those chances to be known; they need not all be equal.
The people drawn and the people who respond may differ. The MacEwan textbook discusses why reaching the sample can be hard. A random draw does not make all people respond. Keep the draw rule, gaps in the frame, and missing answers distinct when checking a claim. For a different list-based rule, see systematic sampling.
Check study passages in Atlas
Add the study methods, any sampling appendix, and the group definitions to one project. Use material you have permission to share. The goal is a note that links each design claim to its source and keeps missing details visible.
Open a chat, type @ to select the methods and appendix, and ask: “Which groups are strata, which are clusters, and how are students selected? Cite each step. Mark any unreported step as unknown.” Choose Project only to keep new retrieval within the supplied material.
For Procedure C, a draft answer might say every student in the chosen schools was surveyed. Open the citation beside that claim. The passage says students were randomly selected, so revise the note to say a second-stage student sample was used.
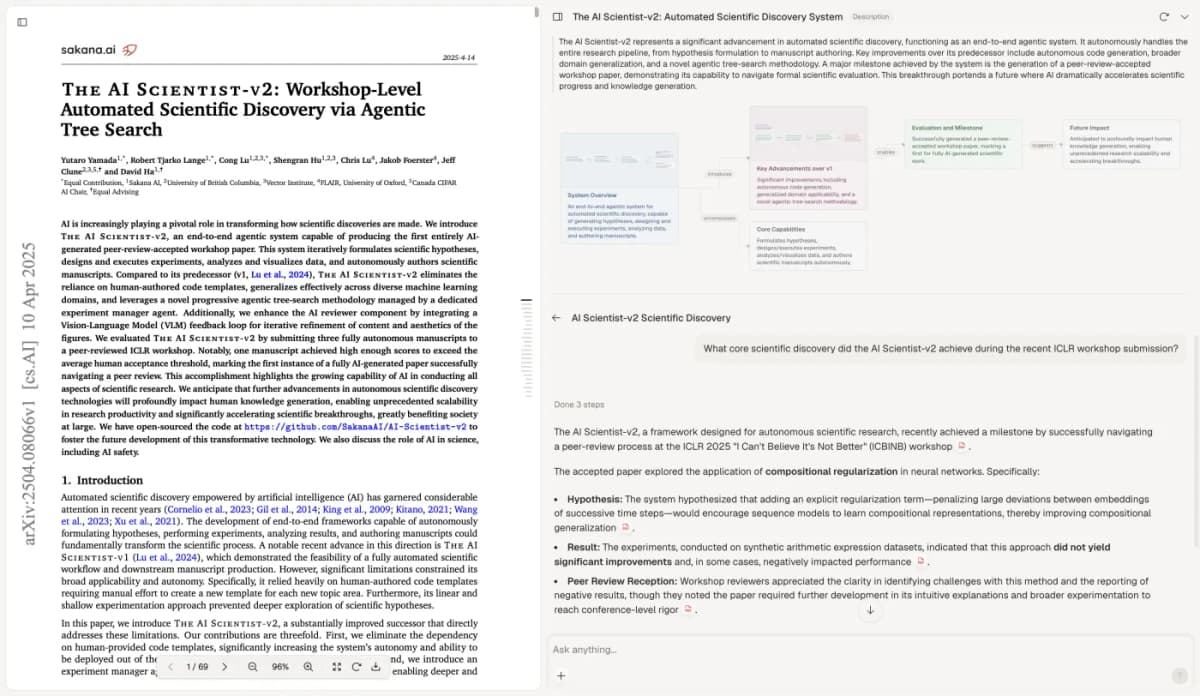
The source panel shows the passage beside the answer you need to check.
The embedded paper is Yutaro Yamada et al. (2025), The AI Scientist-v2, licensed under CC BY 4.0. This screenshot is reused unchanged.
The capture above illustrates the citation-review step using an unrelated paper. In the school example, check the passage for each stage and read nearby text for exclusions. If the appendix does not state the allocation or weighting rule, preserve that gap rather than asking Atlas to supply it.
Create a note with New → Note, title it for the study, and save the corrected result:
- Regions are strata because a school is drawn within each region.
- Schools are clusters because only chosen schools supply students.
- Students form a second-stage sample; the report does not include everyone.
- Group sample sizes, weights, and missing answers need their own source passages.
Wait for Saved before closing the note. When new material arrives, revise the affected line and retain the source context. The broader source synthesis workflow can help when several papers describe different designs.
Keep the classification and its limits
Keep the groups, stages, and draw rules in the note. Add the details needed to check the results. Naming a design helps you read the study; it does not prove that the study used the right weights or handled missing answers well.
If authors choose varied cases on purpose rather than draw a random sample, begin with qualitative research design. That method seeks a range of cases and patterns. It has a different purpose from the random designs described here.
Trace the sampling steps
Compare group definitions and selection rules against your study sources.