

A UX research report lets a team see what was studied, what people did, what the researcher concluded, and which decision remains open. Start with the decision the audience faces. Then show the study boundary and the source behind each important finding.
The report can be a document, a short deck, or a note. Its shape depends on the reader. Still, a plan to change the design must not sound like something a user actually did.
If the work drew on interviews and task tests, keep the source files so a reviewer can check a finding in context. Share those files only with people who have access.
Atlas can help compare those supplied files and draft a cited note. Open the cited passages before you share the report; the research team still decides what the evidence means and what it may disclose.

Check report evidence in Atlas
Compare permitted study files and inspect citations behind each finding.
What the report must answer
A useful report answers four questions. Why did we study this? What did we see? What can we learn from it? What should the team consider next? The Government Digital Service research guide keeps session notes, findings, and possible actions in separate steps so readers can tell what came from the study.
Name the study question and the product choice it may inform. State which users, tasks, and product version were in scope. Explain the method in plain words: six people tried to book a time on a test app while a researcher watched. Say how the team chose them, since that limits the claim.
Lead with the findings that matter most so readers grasp the problem even without the source list. The Dscout report template also starts with a short overview, then gives study context and findings. Use that order if it helps, but base the claims on checked notes.
Use a report structure
This structure fits a study that has already ended. Fill it after the team reviews the data, then adjust its length for the reader. Designers may need screen-level detail; leaders may need the main choice and its limits first.
The Maze report guide covers goals, method, findings, next steps, and a source list. It also leaves room to change the format for the reader.
- Decision summary. In a few sentences, state the research question, the strongest checked finding, the practical implication, and the most important limit.
- Study scope. Record the product or prototype version, tasks, participant selection, method, session dates, and what the study did not cover.
- Findings. Give each finding a short claim, the observed behavior or checked quotation, a source locator, and any case that narrows the claim.
- Interpretation. Explain why the evidence may indicate a problem. Distinguish that reading from what a participant directly said or did.
- Recommendations to discuss. Suggest a design change, further study, or decision to defer. State what would test whether the proposed action helps.
- Limits and appendix. Record missing perspectives, method constraints, and links to protected transcripts, clips, notes, or the research plan. Share source material only with people who have permission to access it.
You can copy those six labels into a new note. Keep the overview short. Give enough detail about the study for readers to judge the claims.
The UXtweak report guide also covers background, method, findings, and next steps. Source links give your team a way to check what those sections claim.
For an interview study, the SRQR guideline record names a standard for reporting a whole study. A product team need not claim to meet it.
The useful habit is simpler: show how the team worked and where the findings may not apply.
Trace each finding to evidence
Before polishing the overview, make a short record for each finding. Note the task, what the person did or said, where to find it in the source, and what else might explain it.
Only then write what you think it means. A screen image may show where someone clicked. Session notes may show what happened before and after. Neither one, on its own, proves the cause.
Consider the difference between these statements:
- Observation: A participant opened the help panel twice while trying to change an appointment.
- Interpretation: The change control may not have been visible enough for this participant.
- Recommendation: Test a clearer change control in the next prototype round.
The next step follows from the finding, but it is still a proposal. Another session might show that the person saw the control but did not trust what it would do.
A source link makes that other view easier to check. The GDS analysis guide puts team actions after the review of findings, not inside the original session notes.
If you need to show several quotations, the qualitative data presentation guide explains how to pair a theme with context and a qualifying passage. This report page uses that same discipline across the full study: scope, findings, recommendations, and the decision record.
Worked UX report example
This is a fictional teaching example. The people, session IDs, observations, and source locations below were invented. They do not describe a real product or support a real product decision.
Imagine a researcher watched six people try to move a booking in a test app. The team wants to know if it should change the booking page before the next test.
The report could say: Some people were unsure how to change a booking. This study cannot yet tell whether the label, its place on the page, or the next step caused the delay. The team gets a problem and a clear limit.
The table shows how one finding might travel from a checked source to a testable proposal. The source locators are fictional too; in an actual report they should open the original note or recording for authorized readers.
| Report element | Fictional entry | Check before sharing |
|---|---|---|
| Study scope | Six invited participants attempted to move an appointment in prototype version B. | Record the recruitment criteria and task wording. |
| Observation | In session P03, the participant opened Help twice before finding Change appointment. | Review P03 recording at 08:12–09:05 and surrounding task context. |
| Finding | In this session, the path to changing an appointment was not clear at first. | Compare other sessions; do not describe one case as a majority. |
| Qualifying case | P05 found the control immediately but paused at the confirmation wording. | Keep the different barrier visible rather than merging the cases. |
| Interpretation | Label, position, or uncertainty about the next step might explain the delay. | Mark the cause unresolved until the source and further tests support it. |
| Proposed action | Test a clearer label and confirmation preview in another round. | Agree on the change, task, and success measure before retesting. |
Table 1: This example supports a narrow claim. It does not show that most users would fail or that a new label would fix the flow.
P05 matters because that person had a different problem. If the team ignores that case, a report about a “hidden button” could miss the confusing final step.
The Decoding Research report article groups a report into study, findings, and next steps.
The table keeps that order but adds a source link and open question to one finding. A full report would give each key finding the same care.
Separate findings from recommendations
Write the finding before the action. A finding says what the study can support. A next step asks the product team to make a choice.
Use plain signals: we saw, we think this may mean, and we want to test. The team may choose another path due to build limits, access needs, or a later study.
In the fictional booking study, the team could test a clearer label and a preview of the next step. It would then watch new people try the same task to see if those changes help. The first six sessions reveal the problem but cannot show the effect of an untested fix.
Do not rank issues by how striking a quote sounds. Weigh the task's value, the trouble people had, cases that differ, and the cost of a wrong choice.
If you give a count, state how many people took part and what you counted. Do not turn a small group chosen for interviews into a share of all users.
If the next step affects people or private data, name who will decide and what is still unknown. The team can then act, wait, or ask for more study. The report is still useful when it says what it cannot settle.
Check source passages in Atlas
Put only files you may use in an Atlas project: transcripts, study notes, or past reports. Add supported files while you ask a question, then name the sources with @. Ask for a report outline with the study scope and a few possible findings, with a source link beside each claim. The multi-source synthesis guide shows how to trace a claim back to a file; the UX report adds the team's own study limits and next steps.
Open each key source link and read the words around it. Check who spoke, what task was under way, and whether the draft left out a limit.
If the source is missing or unclear, do not present the claim as settled. Save the checked text as a note. The researcher writes the final next steps after that review.
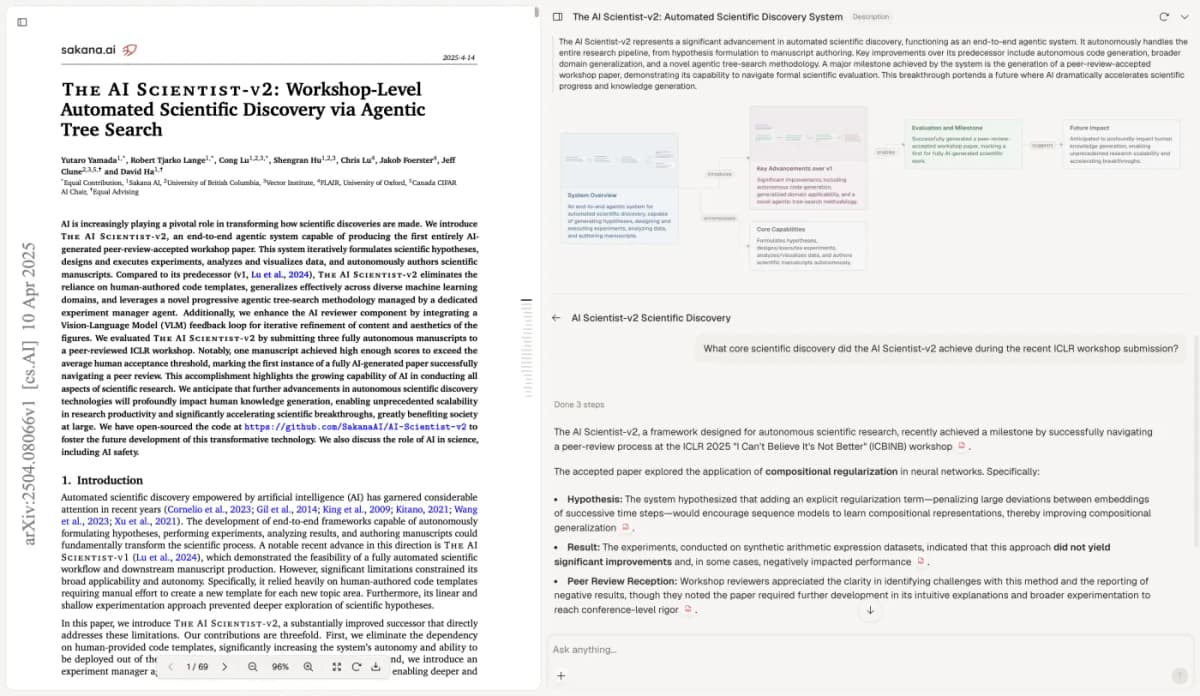
The Atlas screenshot illustrates citation inspection using a paper unrelated to the fictional appointment study. It supplies no evidence for the worked example. The visible excerpt comes from The AI Scientist-v2 by Yutaro Yamada and colleagues, licensed under CC BY 4.0. Screenshot and excerpt are reproduced unchanged. The research team remains responsible for its actual source access and quote permissions.
The UX research AI tool guide helps teams choose software for other research jobs. Here the Atlas step is to compare the files, open the sources, and save wording the team has checked.
Review before sharing
Read the report as someone who did not attend the sessions. Can that person tell which product version was studied, who was invited, which tasks were attempted, and what was out of scope? Can they open the evidence behind the most consequential claims, or understand why access to a protected source is restricted?
Check each quote against its source and the person's sharing rights. Remove details the reader does not need. Several small details together may still reveal who someone is.
Give a case that differs enough space to change the finding when it should. Do not hide that case in a footnote.
Before sharing, mark each finding checked, limited, or open. Checked means the team read the source in context. Limited means another case narrows the claim. Open means the team needs more proof or a weaker claim.
These labels help the team edit the report. They do not score the study's quality.
The audit trail guide helps record why a finding changed. If a new study changes the team's view, revise the report note and keep the source trail.
A future teammate should be able to see why the team reached its view, not just read the final claim.
Check report evidence in Atlas
Compare permitted study files and inspect citations behind each finding.