

Simple random sampling gives every possible sample of the chosen size the same chance of selection. Each eligible unit also has an equal chance. To check a study's claim, look for a complete list of eligible units and a documented random draw.
The word “random” is not enough. A randomly chosen invitation list and the people who answer those invitations are two different groups. The records must show which group the method claim describes.

Check the evidence behind a random sample
Compare the method description with the frame and draw records.
What makes a sample simple random
Suppose a study lists 200 eligible members and selects 20 without replacement. Each member has a 20-in-200 chance of selection. Every possible group of 20 must also have the same chance of being drawn.
Statistics Canada's probability-sampling guide explains both criteria. The second matters because a method can give individuals equal chances while ruling out many possible groups.
The sampling frame is the list used for selection. It needs to identify the units you intend to sample. Units might be people, households, sites or records. A missing person has no chance of selection from that list, even if the draw is random.
Equal chance does not mean a sample will match every population trait perfectly. Chance variation remains. A sample might contain more older members than expected without showing that the draw was rigged.
Keep the target population, the frame and the sample separate in your notes. A claim about all registered members needs a frame that covers those members, not just the people who opened last month's newsletter.
Separate random selection from other patterns
Choosing every tenth entry from a list is systematic sampling. A random starting point can give each entry an equal chance, but the interval constrains which groups can appear together. It is not a simple random draw of every possible group.
A real USGS report by Bart and Hartley contrasts three patterns. Random points appear irregularly at left; systematic points follow a grid in the middle; cluster points occur in groups at right.
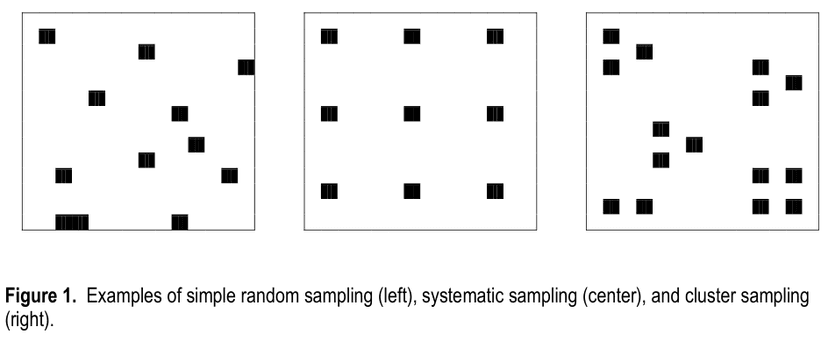
The picture helps name the differences. It cannot prove that a particular study used a random draw. An irregular pattern could arise from convenience selection. Ask how the points were chosen before accepting the label.
The USGS software report groups random and systematic designs for parts of its analysis. That software convention does not make their selection rules identical. Check the procedure described in your own study.
For a broader design decision, use a sampling strategy. Here, the narrower task is to check whether the reported method earns the simple-random label.
Check the frame and draw records
Start with the eligible-unit list. Check its date, inclusion rules and unit IDs. Find duplicates and omissions before the draw. Two entries for one person can give that person more opportunities than others.
Then read the draw method. Does it draw directly from the full list? Does it draw a fixed number? Does it treat all units in the same way? If the study sets quotas for groups, name that design. The whole draw is not simple random.
MacEwan's applied statistics chapter explains same-size sample chances and random-number selection. For an audit, keep the actual method and output alongside the frame version. A seed may help reproduce a draw, but a seed alone does not establish the method.
State whether units can be drawn more than once. Sampling with replacement returns each unit to the pool, so it may recur. Without replacement, it cannot be drawn again. If you drop repeat draws, explain how that changes the result.
Check what happened after selection. Were invitations sent to everyone drawn? Were unavailable people replaced? Did staff choose whoever was easiest to reach as a substitute? These steps can change who supplies data even if the first draw was sound.
Use only records you are permitted to handle. You can inspect coded IDs and selection rules without copying private names into a research tool. Keep the identity key in its approved location.
A worked selection-claim check
The following packet is fictional. A methods draft says: “We obtained a simple random sample of 20 members.” The frame lists 200 unique eligible IDs. The draw selected 20 without replacement, but only 18 members completed the survey.
The draft mixes a claim about the draw with a response count. Three records help separate them:
| Record | What it supports | What remains unresolved |
|---|---|---|
| F1: dated frame, 200 unique IDs | The list used and its stated eligibility rules | Whether any eligible members were omitted |
| D1: procedure and 20 selected IDs | A described draw without replacement from F1 | Whether the implementation followed that procedure |
| R1: invitation and response log | All 20 were invited; 18 responded | Whether response differences affect the reported results |
Table 1: A better draft is: “We selected 20 IDs from the 200-member frame using a simple random draw without replacement; 18 invited members completed the survey.” Use that sentence only after checking the procedure and counts.
Do not call the final 18 respondents a simple random sample merely because their invitations were random. Who responds is a further step that can change the sample. Two missing responses need to be reported even if the difference looks small.
The research methods chapter explains who can enter a sample. The useful question is who could enter the sample and who actually did. Those groups may differ for reasons the draw record cannot explain.
Build a sampling rationale note in Atlas
Start a source comparison with the methods draft, frame notes, draw record and response log you may use. Use coded IDs or a safe description when direct identifiers are unnecessary. Name the sources so you can tell which record supports each claim.
In Ask a question, mention the sources with @ and select Send. Ask: “Compare the sampling claim with the eligible-unit list, draw procedure and response log. Separate supported claims from missing evidence. Cite the record for each conclusion.”
Treat the answer as a review aid. Run and record the draw in your chosen study tool, then inspect its selection procedure. Use Atlas to compare the supplied records. Check the eligible-unit list separately for missing units before accepting the frame as complete.
Open each numbered citation and read the text around it. Check that a sentence about the draw has not been treated as evidence about respondents. If F1 only describes eligibility, it cannot prove that the full membership list was checked.
Create a note with New → Note. Save the frame scope, draw rule, replacement choice, selected count, response count and open checks. Confirm Saved before closing. Keep the correction beside the record locators so another researcher can review it.
Report the draw and its limits
In the methods section, name who you aimed to study, the list used, how you drew IDs and how many you drew. Report any change from the plan and how many people gave usable data. State what the records cannot show.
Review selection bias when missing units or lack of response may skew the findings. A random draw from a list cannot repair gaps in that list or make all invited people respond.
Share records under the study's access rules. A data availability statement tells readers which files they may obtain. It should not promise access to private identity keys.
Before you accept the simple-random label, resolve the frame and draw questions. Then report who responded as a distinct count. A reader should be able to trace each claim to a record and see what still needs checking.
Check the evidence behind a random sample
Compare the method description with the frame and draw records.