

Cluster sampling selects groups, such as schools or local areas, from a population. A study may include everyone who qualifies in each chosen group, or draw a smaller sample within it.
To read a cluster sample, trace both steps. How schools entered the study may tell you little about how students within those schools were picked.
Keep a map of the group list, the rule for choosing groups and the rule used inside each one. This helps you tell who entered the sample apart from who was given a treatment or returned a survey.

Trace the sample in Atlas
Check selection passages and save a source-linked inclusion map.
What cluster sampling selects
Clusters are groups that contain the units a study aims to sample. In a school survey, the school may be the cluster and each student the unit. In a local survey, a block may contain households.
Statistics Canada's probability-sampling guide explains how groups and their units enter a sample. Grouping can cut travel costs by keeping field visits closer together.
The list still sets a boundary. A list of schools in one district covers those schools; it is not a list of all students in a wider region. Check that boundary before saying whom the sample can describe.
Sampling brings groups into a study. A cluster-randomized trial assigns treatments to groups. A study can use both, but each step needs its own account.
Distinguish one-stage and two-stage sampling
In one-stage cluster sampling, the sample includes all eligible units in each chosen cluster. For a school survey, this could mean every student who meets the study's rules in the chosen schools.
In two-stage sampling, the study first picks clusters, then draws a sample within each one. A chosen school might supply a sample of students rather than its full roster.
A design can have more stages. Picking schools, then classes, then students is a different path from picking students straight from school rosters. Keep each step in your account of the sample.
CDC's CASPER method uses area clusters and a sample of households within them. Its counts and field rules belong to that specific method.
The diagram below shows one-stage cluster sampling. Six groups each contain two numbered units. Groups 2, 5 and 6 enter the sample with both units in each group. In a two-stage design, a further draw would select units within the chosen groups.
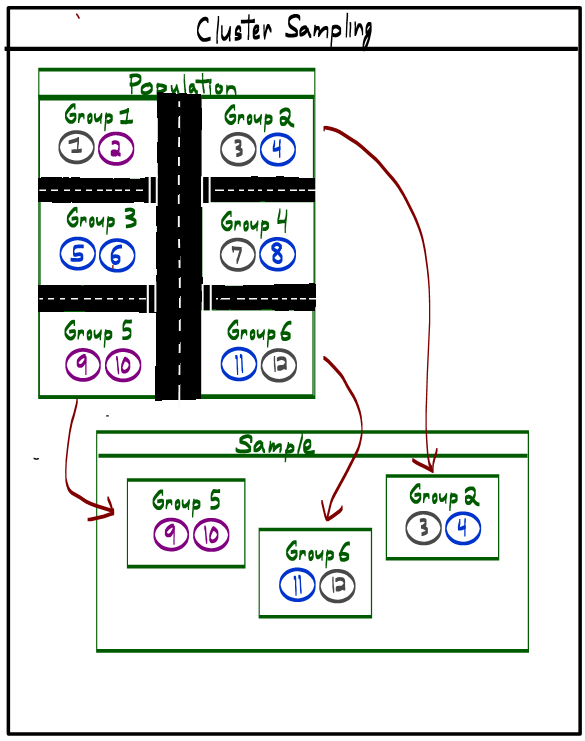
“Cluster Sampling Diagram,” Figure 4 by Toros Berberyan in LibreTexts Sampling Methods, CC BY-SA 4.0. This copy retains that license. Lossless WebP re-encoding left the content and dimensions unchanged.
Stratified sampling draws units from each stratum, rather than choosing only some clusters. Read stratified versus cluster sampling when a study combines the two, so each step keeps its own label.
Map a reported sample in stages
Imagine a fictional survey with a list of 20 schools. The study picks four by simple random sampling, then randomly picks 10 students from a roster of 50 eligible students in each chosen school.
The map below keeps the two stages apart and shows what you need to know about each one. All counts and passage labels are teaching examples, rather than data from a real study.
| Evidence component | Fictional report | Selection interpretation | Question to retain |
|---|---|---|---|
| Cluster frame | Methods paragraph 1 lists 20 schools | The school list sets the first-stage boundary | Which schools or students were outside the list? |
| Cluster selection | Paragraph 2 picks four schools at random | Four of 20 schools enter the sample | Was each school picked no more than once? |
| Student selection | Paragraph 3 picks 10 of 50 eligible students per school | Students are sampled within chosen clusters | Were all rosters complete and current? |
| Response | Results gives completed surveys only | Those who respond are a subset of those picked | Which chosen students did not respond? |
Table 1: The map keeps the list, the draw and the response as separate facts.
For this simple random draw, each school has a 4/20 chance of being picked. Given that a school is picked, each student on its roster has a 10/50 chance of being picked in the next draw.
Multiply those chances: 0.2 × 0.2 = 0.04, or 4%. This is a listed student's inclusion probability in the toy design. It is their chance of entering the sample, rather than their chance of replying to the survey.
If the report leaves out the rule for choosing students, you cannot work out the second chance. Change an “equal chance for every student” note to state the school rule and the gap in the student stage.
The result changes if rosters vary in size but each school supplies the same number of students. Keep the 4% figure tied to the equal-size rosters and random draws in this example.
Keep coverage and probability gaps visible
The group list must cover the population a study claims to describe. Check how and when it was made, and which groups it leaves out. The sampling-frame guide explains how to read that boundary.
Equal chances for groups need not mean equal chances for people. The rule inside each group matters too. For example, picking 10 students from a school with 50 eligible students gives each one a higher chance than picking 10 from a school with 100 eligible students.
Some designs give larger clusters a higher chance of being picked. CDC's CASPER method is one example. Keep the study's size measure and draw rule, rather than replacing them with the equal-school example.
Also record whether a cluster can be picked more than once: sampling with or without replacement. Repeat draws, swaps or changes to the list can affect which units enter the sample.
Keep nonresponse in its own part of the map. A chosen student who does not return the survey differs from a student who was never picked. A count of replies should not hide either group.
Statistics Canada's quality guidelines treat clustering, stratification, nonresponse and the estimator together. A survey specialist should judge weights and precision using the study's actual design.
Students in one school may share traits that matter to the survey, such as the sports they can play there. A large sample from a few schools may thus give less varied evidence than the same number drawn across many schools.
Read how the study's analysis took account of its sample design. A stage map helps you check that account. It does not provide a design effect, a valid standard error or proof that the sample represents the whole population.
Reconstruct the inclusion map in Atlas
Add the sampling report, group list and supplement to an Atlas project, where you have permission to use them. Wait for processing to finish, open a chat and use @ to select the sources for the sample's stages.
Ask: “Map the group list, how clusters were picked and how units inside them were picked. Cite each stage. Keep chosen units apart from those who replied, and flag missing rules or chances.”
Open each citation and read the text around it. Check that it describes the sample draw, rather than who was easy to recruit, who got a treatment, a roster change or who was later kept in the analysis.
If an answer says that every student had equal chances, check both stages. In the fictional case where the student rule is missing, replace that claim with the known school rule and the gap in the student stage.
Ask a follow-up about who counts as an eligible student or which schools were left out. Keep the source name and version with the entry. This helps when a protocol and final report describe different rules.
If the citation opens a source without showing the exact passage, find the section yourself. A citation points to text you can check; it does not prove that the text supports the claim.
Use New then Note to save the corrected map, source references and gaps. Wait for Saved. Keep the draw and the response in separate fields so later evidence can update one without changing the other.
Across several surveys, use the same stage fields while keeping each study's rules. The research synthesis workflow helps keep each source's findings clear in a wider comparison.
Write the supported sampling description
A final account should name the cluster, unit, list and draw stages. For the fictional survey, say that four schools were picked at random from a list of 20, with students then picked within those schools.
Add the student rule only when you have its passage. Keep any roster sizes and sampling fractions with the facts needed to read them, rather than assuming that all stages gave each person the same chance.
Keep response and analysis counts apart from the sample draw. If some chosen units do not appear in the results, that gap needs its own account. It should not silently change the record of who was picked.
Before judging whom the sample can represent, check the list's limits and any missing stage rules. Take questions about weights, variance and design effects to a survey specialist with the source methods.
Trace the sample in Atlas
Check selection passages and save a source-linked inclusion map.