

A study can show a large sample and balanced groups while saying little about how people joined. To compare probability and non-probability sampling, find the rule for choosing cases and the claim the research needs to support.

Compare sampling evidence in Atlas
Check selection passages and keep the evidence for your methods note.
The distinction is known selection chances
Probability sampling uses a chance design with known, nonzero chances of selection. Non-probability sampling does not establish those chances for the target population. Equal chances are used in some probability designs, but not all.
Statistics Canada explains that the chances can be unequal. The key is whether the design gives them. The analysis can then account for how cases were drawn.
A non-probability method may reach available people, choose cases for their relevance, fill group targets, or use peer referrals. It can serve a research question without supplying a chance-based estimate for the whole target group.
What a probability design supplies
A probability design states a chance rule for choosing units. A simple random draw is one example. Stratified designs draw within groups. Cluster designs select groups as part of the process. QuestionPro's method guide covers these named designs.
The full set of steps determines the chances. A method name alone should lead you to the rule in the report, rather than replace it.
A sampling frame is the information used to find units for selection. It might be a register or a list of areas. The National Library of Medicine course separates the target group, frame, and final sample.
Some designs give units different chances on purpose. A team might draw more heavily from a small group to learn about it. The estimates and weights must reflect that rule rather than treating each reply as if it had the same chance of inclusion.
Chance selection still leaves variation between possible samples. One draw may differ from the wider group on some traits. The design gives a basis for assessing that uncertainty, rather than a promise of an exact match.
Three further checks remain: who is missing from the frame, who does not reply, and whether the questions measure what the study needs. A random draw from an incomplete list does not reach the names left off it.
What non-probability selection can serve
A question may need detailed accounts from people with a specific experience. Interviews with people who handled a route closure can show how they adapted. The aim may be to understand those accounts rather than estimate their frequency across all commuters.
The JIBC methods textbook connects the sampling choice to the research goal. State why the cases can inform the question and whose views might still be absent.
The methods evidence should name how people were reached. Convenience recruitment reaches available people. Purposeful selection seeks cases relevant to the question. Quota sampling fills preset group counts, while snowball sampling reaches people through peer referrals.
A study can combine these routes. The team might choose first contacts for their experience, invite their peers, and track group counts. Report those stages rather than picking one label to stand in for the whole process.
Wider estimates from non-probability data need a further basis, such as stated model assumptions and suitable outside data. The route into the study alone does not supply a standard sampling margin of error.
Compare designs against the research question
Match the method to the claim
Decide what you need to learn before comparing speed or cost. This table keeps the basis for choosing cases apart from the claims the study seeks to make.
| Criterion | Probability sampling | Non-probability sampling |
|---|---|---|
| How cases enter | Stated chance design | Access, purpose, quotas, referrals, or another route |
| Chances for the target group | Known from the design | Not established for all target units |
| Wider estimates | Appropriate design supports estimates and uncertainty analysis | Added assumptions and evidence are needed |
| Question fit | Estimating traits of a defined wider group | Exploring relevant cases or reaching people when a probability design is unsuitable |
Table 1: The question and selection rules govern fit; a larger count does not change the sampling family.
For a campus-wide estimate of late-bus use, a suitable register and chance design may serve the question. Interviews about adapting to a route closure seek a different kind of insight. They need a reason for choosing those cases.
Keep design and result apart
Statistics Canada's non-probability guidance cautions about assumptions used for claims beyond non-random recruits. A strong report states those assumptions instead of relying on the sample count.
Stat Trek's guide also distinguishes known selection chances. If a report lists matching age or region counts, find the entry rule before deciding which family it belongs to.
Assigning a treatment at random is a different step. The random sampling vs random assignment guide explains why a chance rule for conditions does not prove chance selection into the study.
Read a worked selection example
A register survey and purposeful interviews
Consider two made-up campus projects. One asks how many eligible students use the late bus. The other asks how students adapted after a route closure. There are no observed findings in these teaching cases.
The survey draws 100 names at random from an eligible-student register. The interviews seek people with route-closure experience and different ways of adapting. These accounts describe different ways of choosing cases.
Keep the question, list or case rationale, selection rule, and open issue for each project. The source labels below are invented teaching aids:
- Survey S1: The register and random draw are stated. The last update to the register is not reported.
- Survey S2: Selected students are invited to reply. The names drawn and the replies received are separate sets.
- Interview I1: Direct route-closure experience is the entry rule. Cases are chosen for their relevance rather than known population chances.
- Interview I2: The team seeks different accounts of adaptation. That range helps explore the question but does not create a probability design.
Preserve the missing evidence
A checked note can describe the survey draw as probability-based while leaving the register update unknown. The gap raises a question about coverage. It does not prove that names were drawn non-randomly.
For the interviews, keep the reason for choosing cases and the limits on whose accounts are included. Several groups can be represented without known selection chances. Scribbr's guide covers the common named methods.
If a report says only “100 balanced respondents,” leave the family unclear until you find the rule. Equal group counts could come from a chance design or non-random quotas. The visible result cannot settle how it was produced.
Save a checked sampling comparison
Ask about the basis for selection
Add the methods, research questions, and frame details to one Atlas project, using the research assistant workflow. Once they have processed, use @ in a chat to select them. Ask about how cases were chosen separately from the authors' wider claims.
For example: “Compare these sampling accounts. Give the question, stated frame or case rationale, selection rule, known chances if reported, and source citation. Mark missing evidence. Separate the design label from limits on wider claims.”
Inspect and correct each row
Open each citation for a claim you will keep. A passage on group counts does not prove a random draw. A random draw does not prove full list coverage or that everyone replied. Read the surrounding source text for those limits.
If Atlas calls a quota-balanced sample probability-based, check its entry rule. Revise the note if the team kept first-available replies. If no rule is supplied, keep “unknown” rather than guessing which label applies.
The Atlas view below shows a cited answer beside the original source. It illustrates where to check support for the claim. The visible AI paper is unrelated to the made-up campus projects and gives no evidence about their sampling rules.
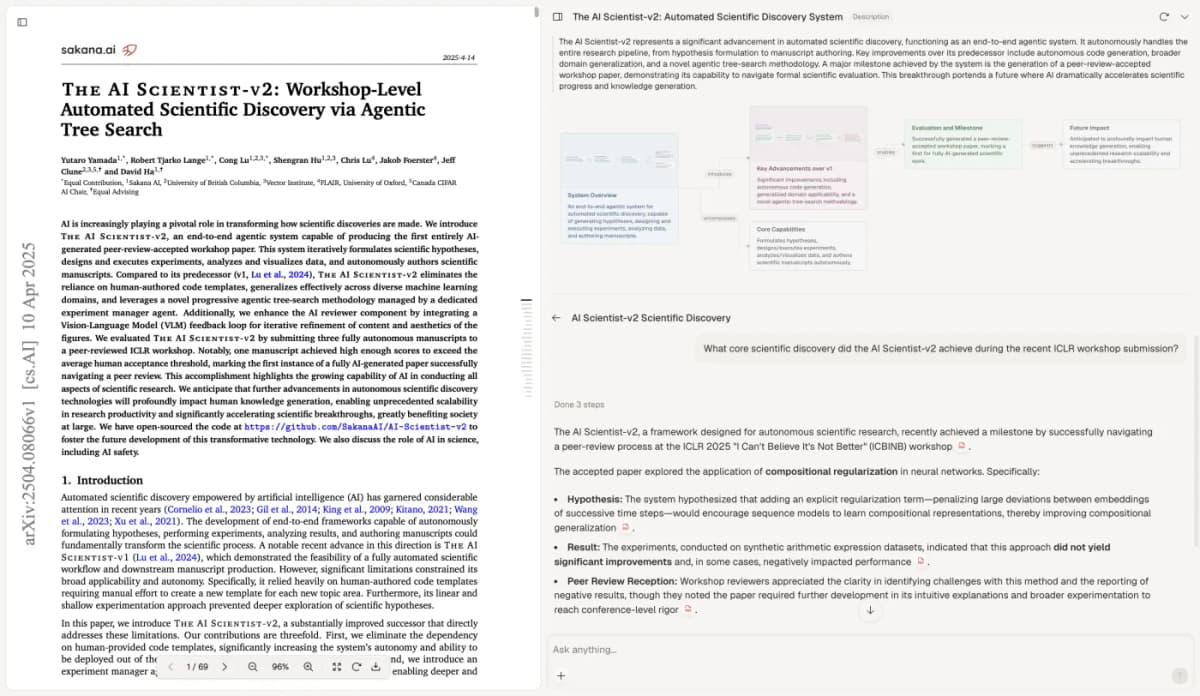
Read the original selection passage before keeping a design label in the methods note. The visible paper is Yamada et al.'s The AI Scientist-v2 (2025), licensed under CC BY 4.0. This Atlas capture is unchanged.
Keep the method and claim aligned
For a methods note, choose a design label only when the source gives its selection rule. Save the known-chance-versus-purpose comparison through New, then Note, with the checked passages and corrections.
Keep the frame questions alongside the label. Wait for Saved and update the note when a revised appendix fills a gap. Use a wider claim only when the study gives a sound basis for it.
Atlas helps compare supplied sources and keep checked findings. It does not choose the method, run the statistics, or prove a study is sound. The team owns the method, ethics, and final claims.
Compare sampling evidence in Atlas
Check selection passages and keep the evidence for your methods note.