Visual Note-Taking: 6 Methods and Tool Fit (2026)
6 visual note taking methods scored on learning curve, retention benefits, and use case: mind mapping, sketchnoting, concept mapping, flowcharts, Cornell.
- Byline

Summary
Use visual note-taking when spatial structure helps you understand relationships faster than linear notes.
The updated guide compares mind mapping, sketchnoting, concept mapping, flowcharts, Cornell notes, and visual outlines.
Tool fit depends on handwriting, collaboration, source grounding, review speed, and whether maps need to become reusable knowledge.
Paper, iPad apps, whiteboards, Obsidian Canvas, and Atlas each fit a different job.

Atlas for source-grounded maps
Compare tools that turn PDFs, papers, and notes into source-linked mind maps.
Visual note-taking turns notes into a layout. Use position, arrows, boxes, branches, and small drawings to show how ideas relate. A useful test is the "source, step, or sketch" rule. Use concept maps for source-heavy ideas. Use flowcharts for steps. Use sketchnotes when the cue matters more than the order.
How This Guide Scores the Methods
This guide uses a simple capture-fit rubric. Each method gets a 1-3 score for three jobs: capturing live material, joining source material, and reviewing later. A score of 3 means the method is a strong fit without much cleanup. A score of 1 means it works only in narrow cases.
| Method | Live capture | Source synthesis | Review speed | Best use |
|---|---|---|---|---|
| Mind mapping | 3 | 2 | 3 | Fast topic overview |
| Sketchnoting | 2 | 1 | 3 | Talks and memorable examples |
| Concept mapping | 1 | 3 | 2 | Papers, theories, and systems |
| Flowcharts | 2 | 2 | 2 | Steps, choices, and methods |
| Cornell visual | 3 | 2 | 3 | Classes and recall practice |
| Bullet journal spreads | 1 | 1 | 2 | Planning and progress tracking |
Table 1: Capture-fit rubric for the six visual methods.
Why Do Visual Notes Work?
For a side-by-side benchmark of nine mind-mapping tools, including time-to-first-node and weekly-maintenance scores, see our mind-mapping software guide.
Dual coding theory says that using words and visuals gives your brain two paths back to the same idea. Visual notes also make you process the source before you write it down.
Visual note-taking is not just a style preference. It helps for four practical reasons:
Dual coding: Words and diagrams give your brain two ways back to the same idea.
Active work: Visual notes force you to interpret information before recording it. You cannot just transcribe. You have to choose what matters, how ideas link, and where each idea belongs.
Spatial memory: A position on the page becomes a cue. You may forget the exact wording, but remember that the point sat in the lower-left branch beside the example.
Pattern recognition: A layout shows shared themes, parallel steps, and contradictions faster than a paragraph can.
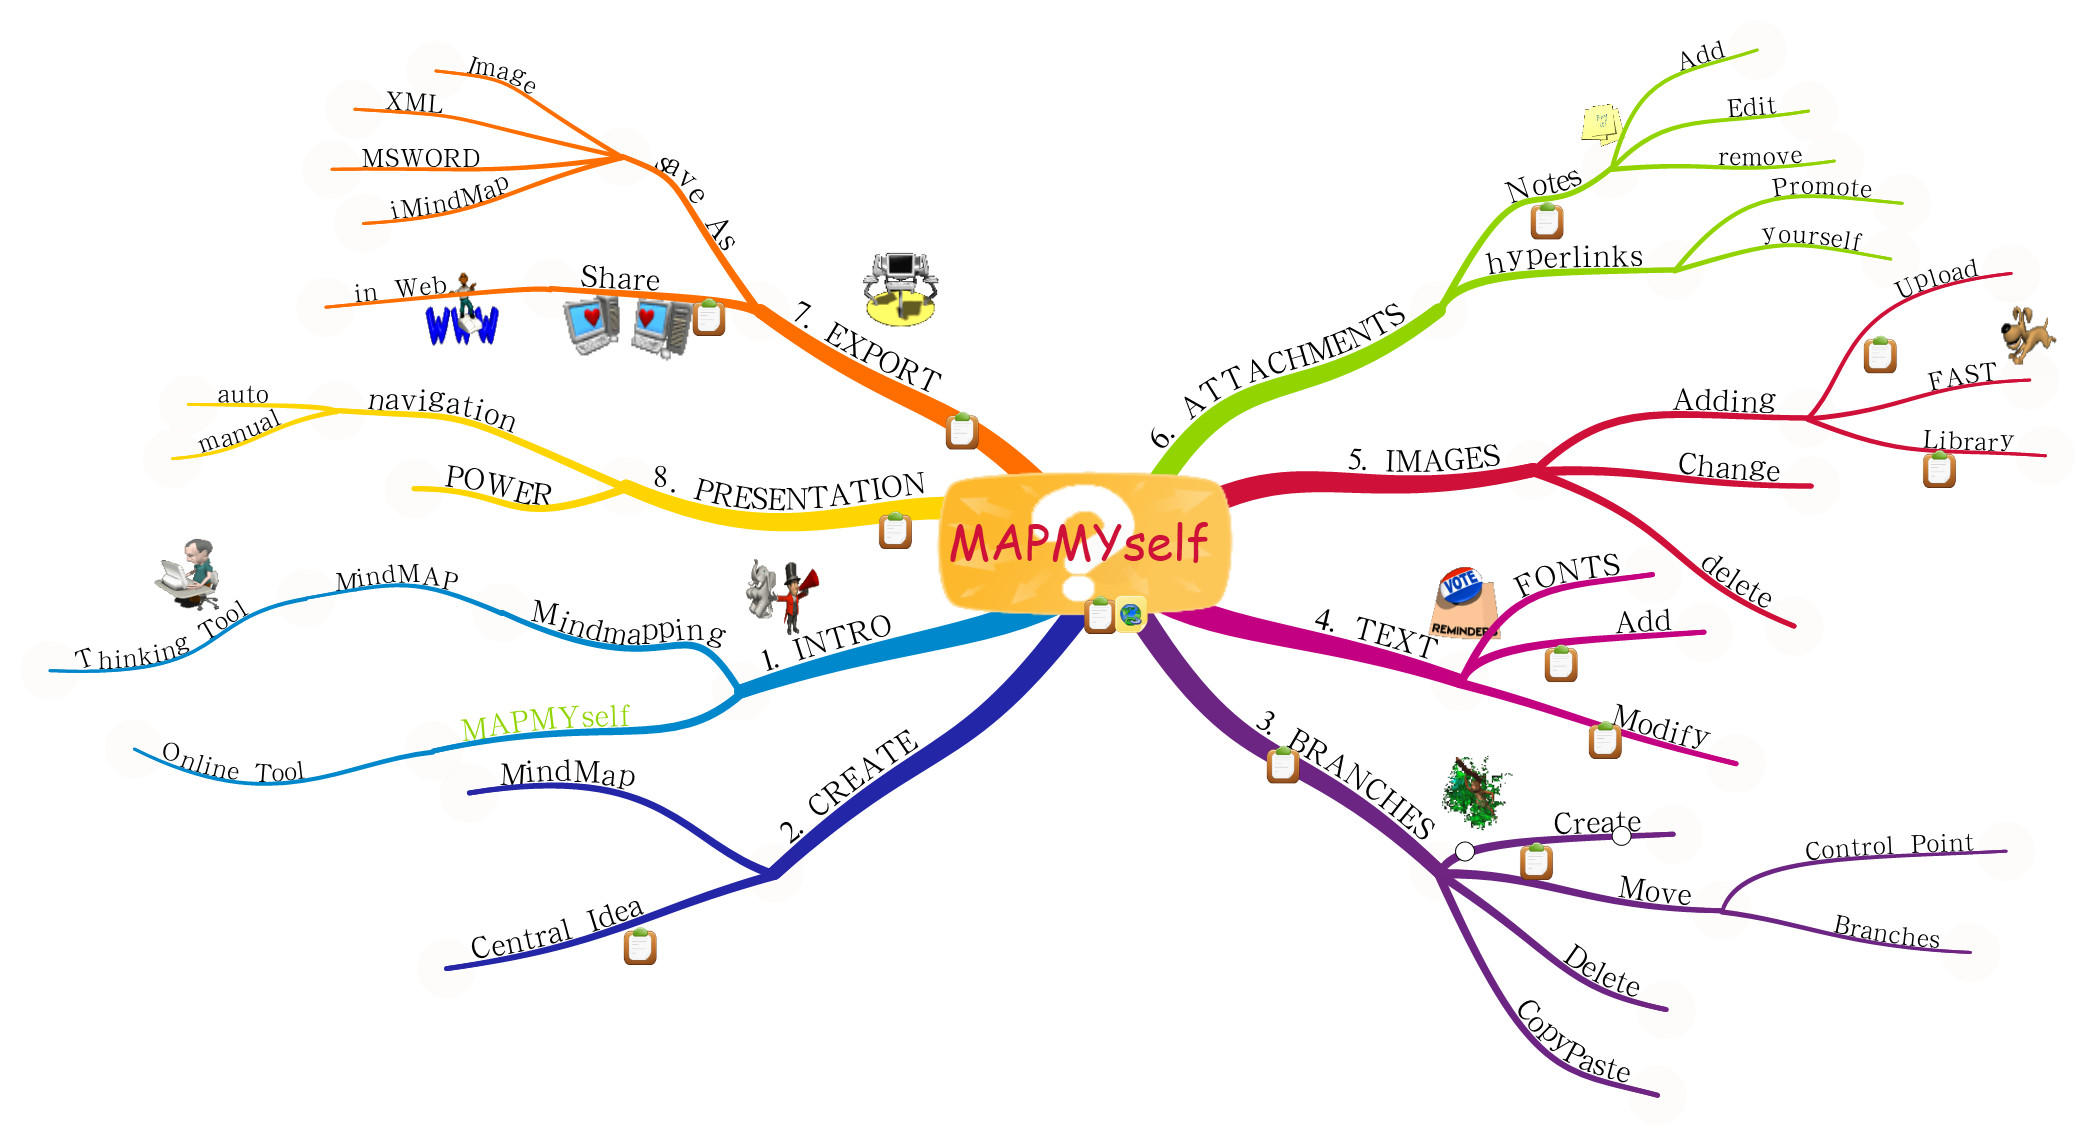
Method 1: Mind Mapping
Mind mapping is the most well-known visual note-taking method. You start with a central topic and branch outward, creating a hierarchical tree of concepts.
Use mind mapping when the material has one clear center. For example, a biology chapter on cell structure can start with "cell" in the middle, then branch into membrane, nucleus, organelles, transport, and energy. A flowchart would overstate the order, and a concept map would take longer than the topic needs.
How It Works
- Write the main topic in the center of the page.
- Draw branches for major subtopics.
- Add secondary branches for supporting details.
- Use color to mark groups.
- Add keywords rather than full sentences.
When to Use Mind Mapping
- Lectures with a clear central topic.
- Reading a chapter with a clear hierarchy.
- Brainstorming for an essay or project.
- Reviewing a topic before an exam.
Strengths
- Quick to learn.
- Shows hierarchy.
- Easy to review at a glance.
- Works on paper or in apps.
Limitations
- Weak for cross-links.
- Needs one central topic.
- Gets crowded with too many branches.
- Poor fit for steps and processes.
For a deeper guide with specific exam strategies, see our post on mind mapping for exam success. To explore software options, check out our guide to AI mind map generators.
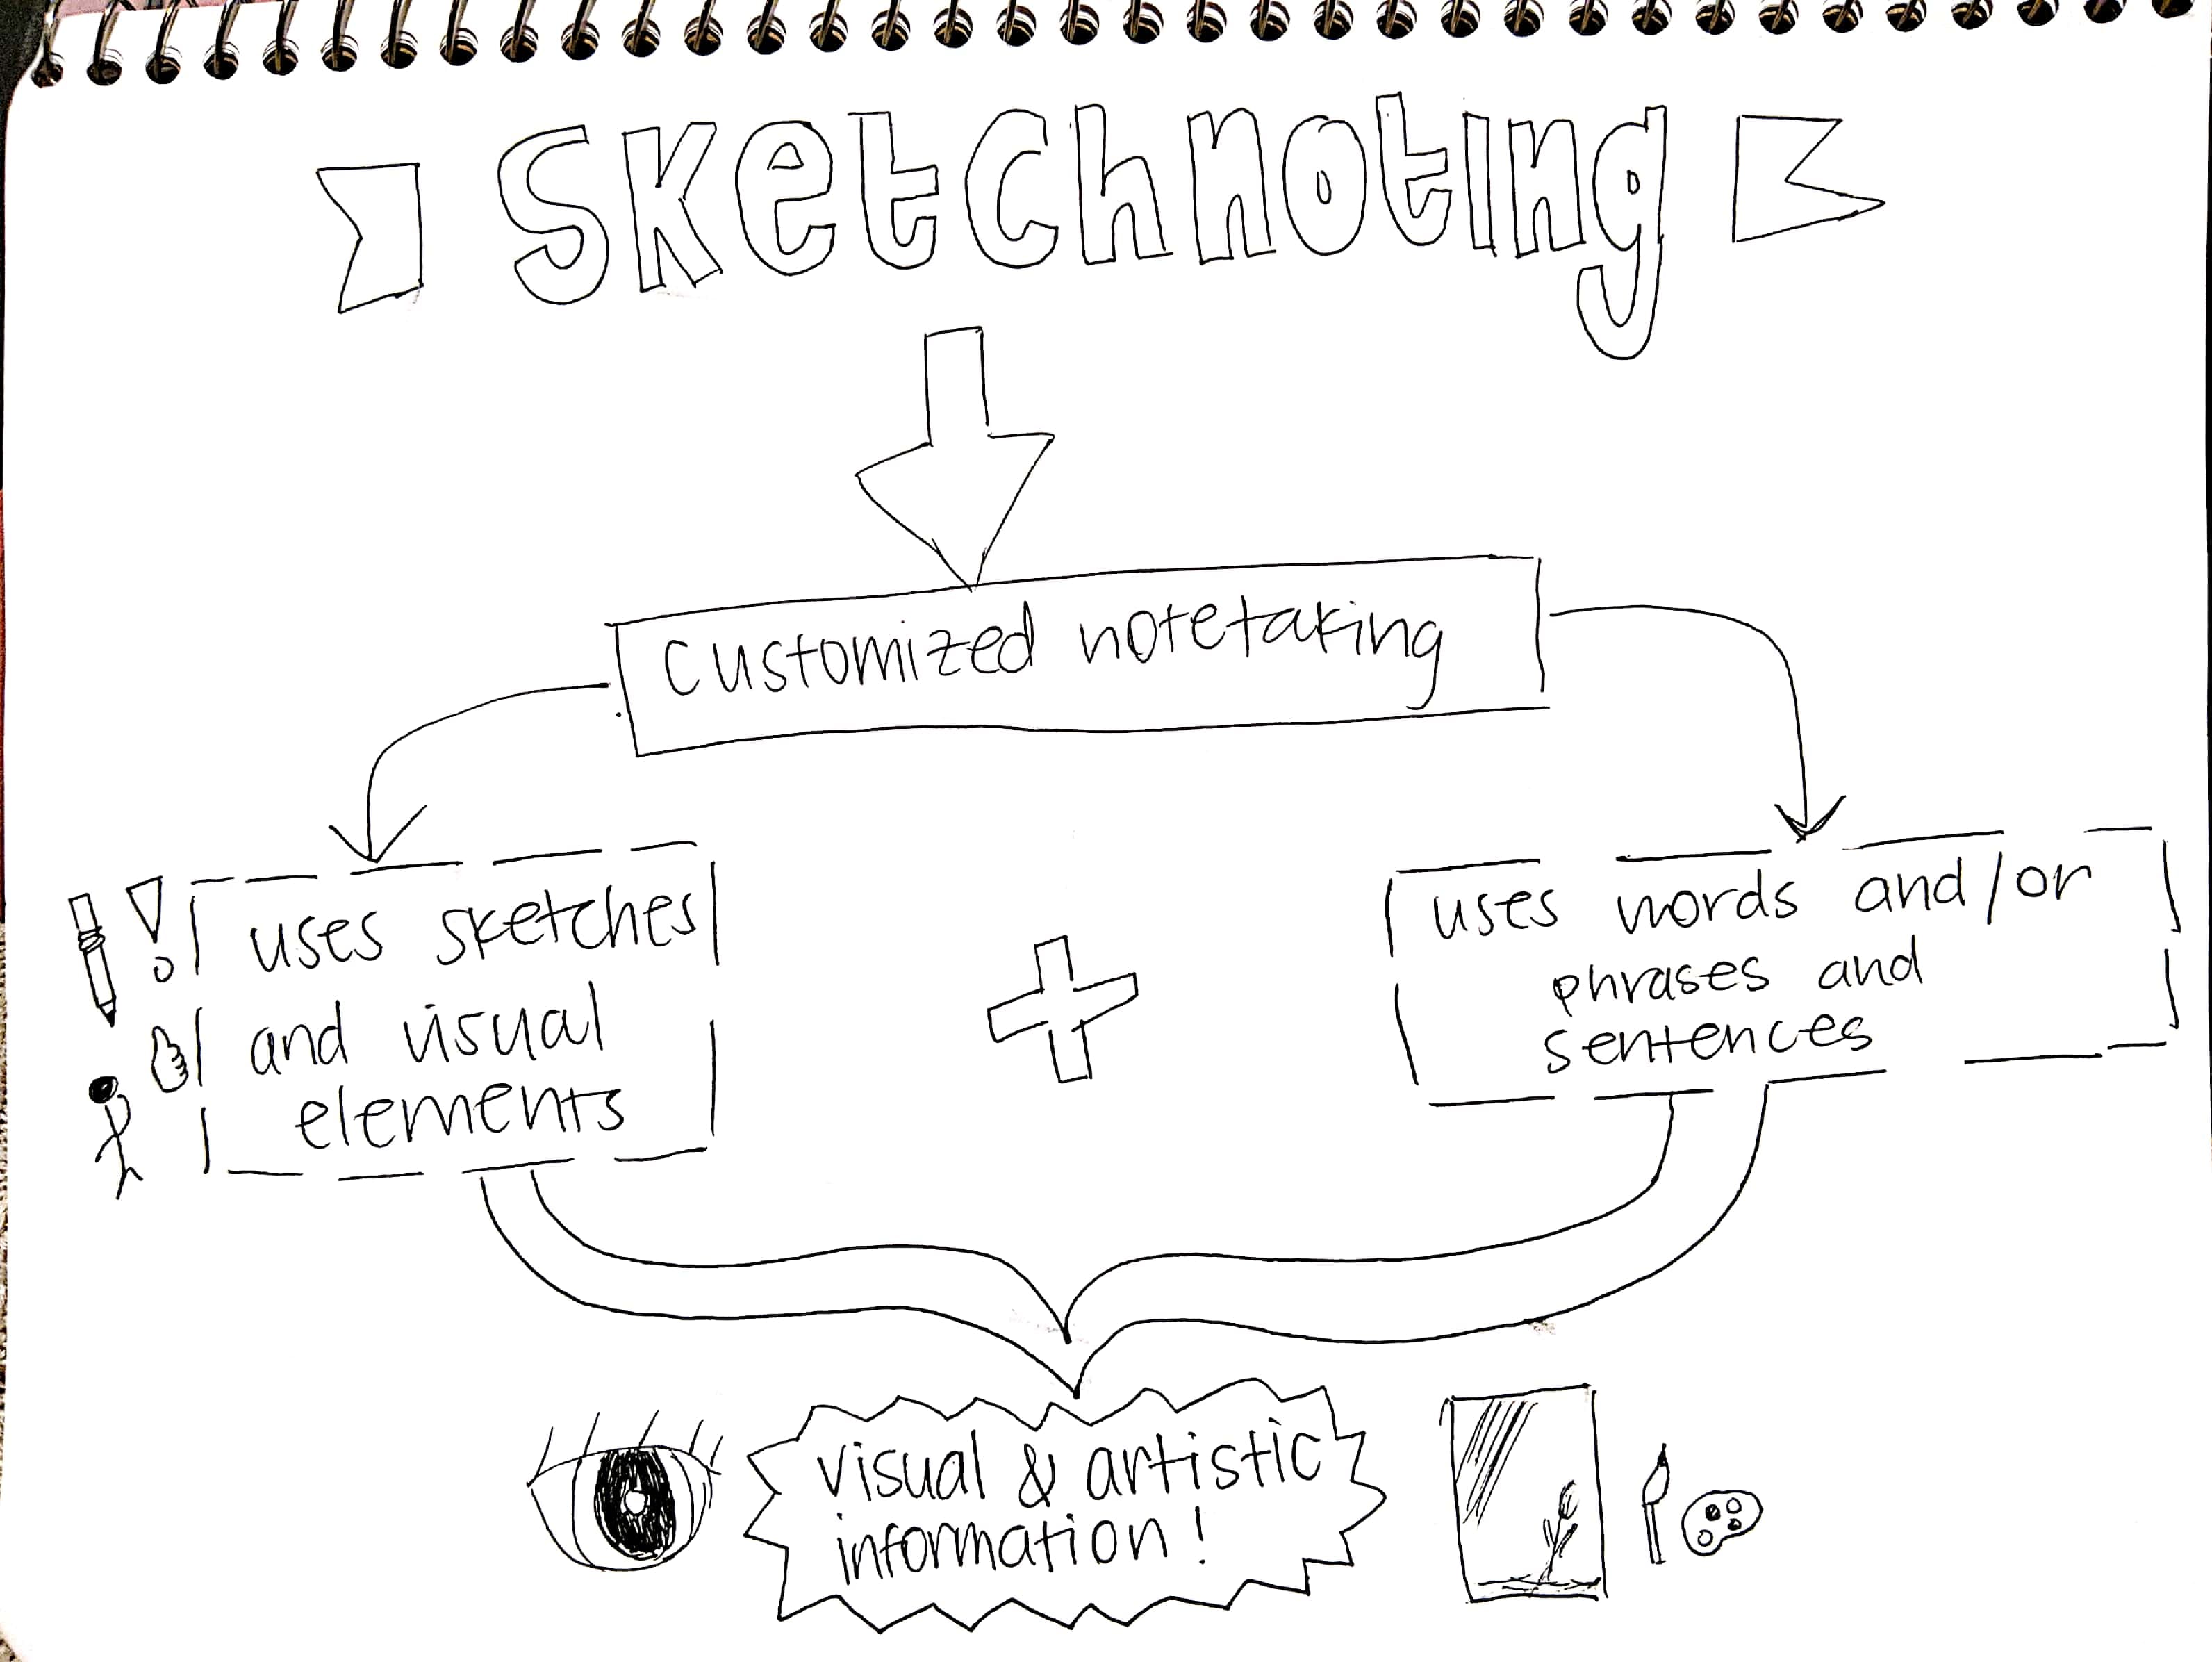
Method 2: Sketchnoting
How It Works
- Listen or read and capture key ideas as they come.
- Use simple icons and drawings beside text.
- Vary text size to show importance.
- Connect related ideas with arrows and lines.
- Use borders and boxes to group ideas.
When to Use Sketchnoting
- Conference talks and presentations.
- Podcast or video notes.
- Meeting notes you plan to share.
- Book chapter summaries.
Strengths
- Fun to create and review.
- Flexible layout.
- Easy to remember.
- Makes notes worth revisiting.
Limitations
- Slower in fast lectures.
- Hard to reorganize later.
- Can feel intimidating at first.
- Poor fit for highly structured material.
Getting Started with Sketchnoting
You don't need artistic talent. The five basic sketchnoting elements are:
- Text: Different sizes and weights.
- Containers: Boxes, circles, and banners around text.
- Connectors: Arrows, lines, and dotted paths.
- Icons: Simple drawings, such as a bulb, person, star, or arrow.
- Separators: Lines, borders, and white space.
Practice these five elements and you can sketchnote anything.
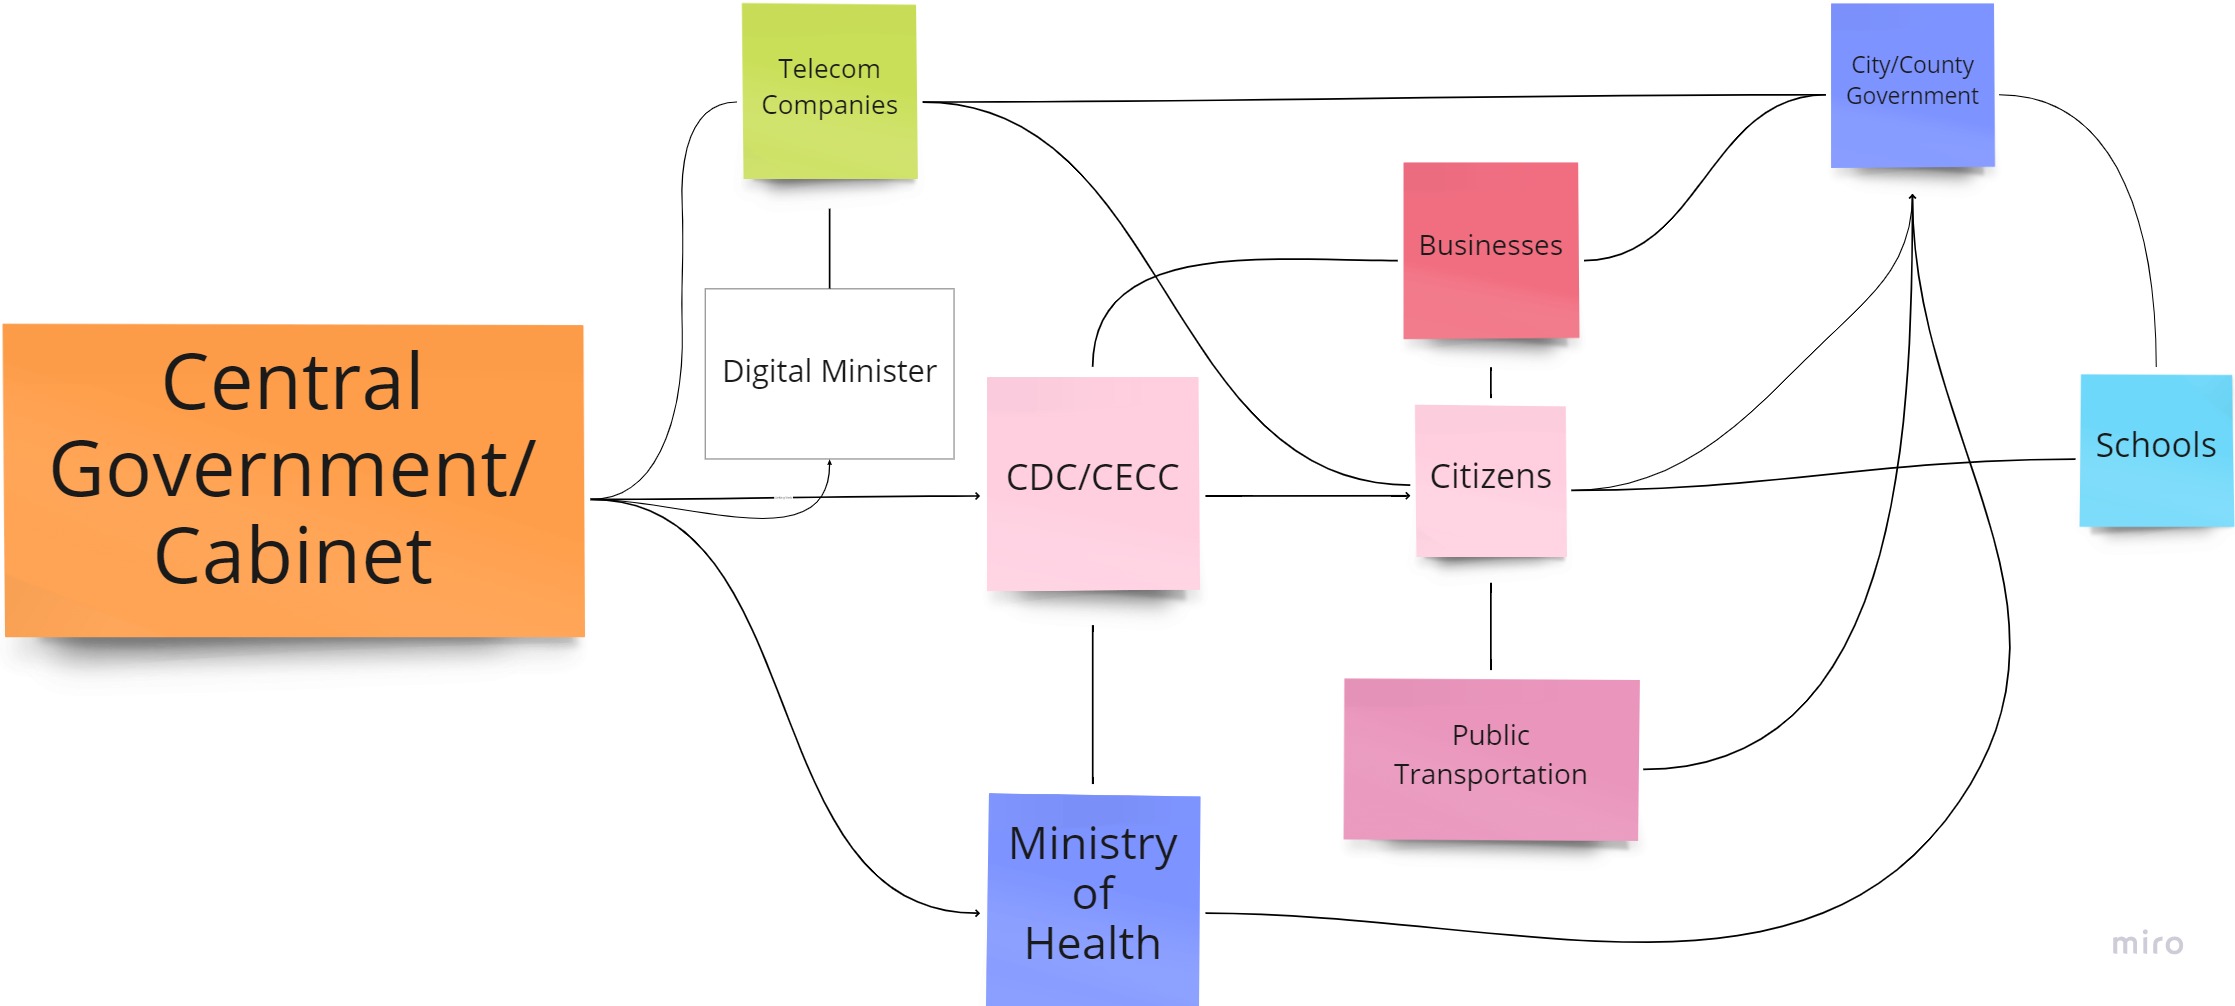
Method 3: Concept Mapping
Concept maps look similar to mind maps but work differently. Instead of branching from a single center, concept maps connect concepts with labeled relationships. "leads to," "is a type of," "depends on."
How It Works
- Pick the key concepts.
- Put broad ideas near the top and details lower down.
- Draw lines between related ideas.
- Label each line with the link, such as "causes" or "requires."
- Look for cross-links between branches.
When to Use Concept Mapping
- Understanding systems with many parts.
- Comparing theories or frameworks.
- Mapping cause and effect.
- Preparing a synthesis or literature review.
Strengths
- Labeled links add precision.
- Cross-links reveal deeper ties.
- Better than mind maps for non-linear topics.
- Helps expose gaps.
Limitations
- Slower to create.
- Can look messy.
- Hard to build during a live lecture.
- Takes more effort.
Concept mapping is building a personal mind map by hand. For a comparison of these two approaches, see our guide on concept maps vs mind maps. For digital tools that automate this process, see our guide to knowledge graph tools.
Method 4: Flowcharts and Process Diagrams
Flowcharts capture steps, choices, and process flow.
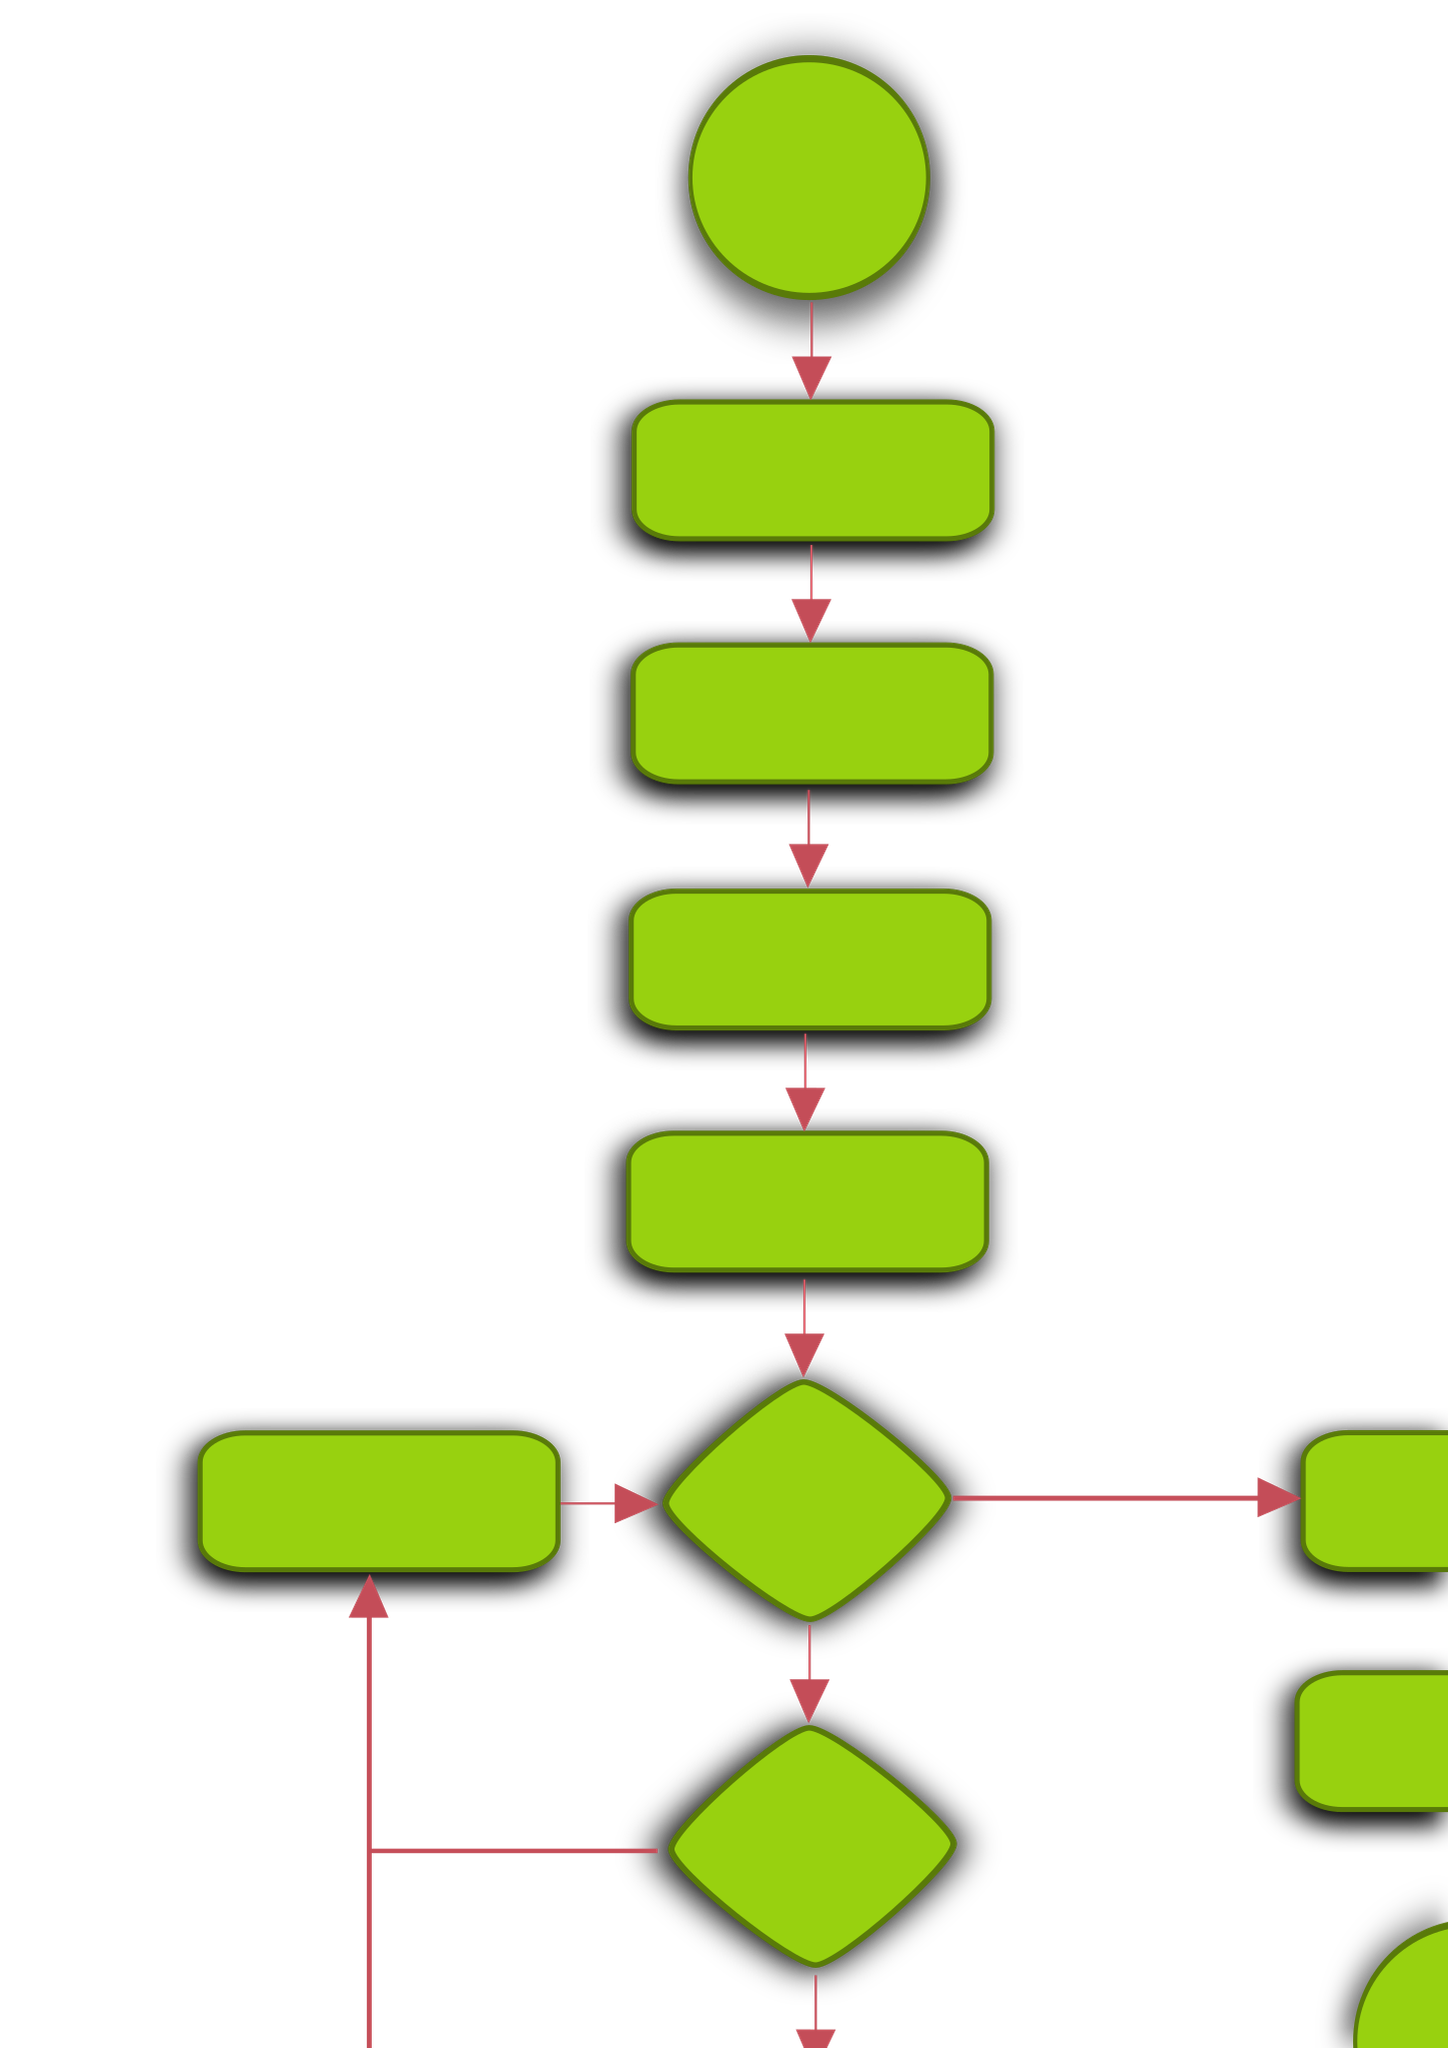
How It Works
- Pick the starting point.
- Map each step in order.
- Use diamonds for yes/no choices.
- Use rectangles for actions.
- Use arrows to show direction.
When to Use Flowcharts
- Lab methods and experiments.
- Programming logic.
- Decision frameworks.
- Business workflows.
Strengths
- Strong for steps.
- Clear at decision points.
- Easy to follow.
- Widely understood.
Limitations
- Only works for steps or branches.
- Weak for theory.
- Can sprawl with many branches.
- Shows the steps more clearly than the reasons behind them.
Method 5: Cornell Visual Method
The Cornell method is traditionally text-based, but adapting it with visual elements creates a structured yet flexible note-taking system.
How It Works
- Divide the page into three parts: left cue column, main note area, and bottom summary.
- In the main area, draw mini maps, sketches, or diagrams.
- In the left column, write cue questions or keywords.
- At the bottom, draw a short visual summary.
- For review, cover the right side and test yourself.
When to Use the Cornell Visual Method
- Lectures that need structure.
- Study sessions with repeated review.
- Topics that mix facts, ideas, and steps.
- Notes where recall matters.
Strengths
- Built-in review.
- Structured but still flexible.
- Works for quick notes or study sheets.
- Works in notebooks and apps.
Limitations
- Needs page setup.
- The summary takes extra time.
- Can feel too rigid for brainstorming.
- Less free than sketchnoting.
Method 6: Bullet Journal Spreads
Bullet journal visual spreads use dedicated page layouts for specific topics, combining tracking, lists, and visual elements.
How It Works
- Give one topic a two-page spread.
- Add headers, sections, trackers, or timelines.
- Use rapid logging marks for tasks, events, and notes.
- Add small charts or progress bars.
- Index the spread so you can find it later.
When to Use Bullet Journal Spreads
- Tracking course or project progress.
- Weekly or monthly review.
- Goal setting and study habits.
- A visual index for a semester.
Strengths
- Highly personal.
- Combines planning with notes.
- The layout work can aid recall.
- Creates a record of progress.
Limitations
- Slow to set up.
- Harder to search on paper.
- Can become decoration work.
- Weak for dense academic detail.
Comparison: Which Method When?
Use this table as a quick first pass. If two methods look close, choose the one that matches the material's shape: branches, sketches, labeled links, steps, review prompts, or planning pages.
| Method | Best for label | Speed | Best content type | Learning curve | Retention benefits | Tool compatibility |
|---|---|---|---|---|---|---|
| Mind mapping | Fast overviews | Fast | Hierarchical topics | Low | High | MindNode, Coggle, Xmind |
| Sketchnoting | Live talks | Medium | Talks, videos, presentations | Medium | High | Paper, reMarkable, GoodNotes |
| Concept mapping | Source synthesis | Slow | Complex systems and theories | High | High | Atlas for source-grounded maps, Miro or CmapTools for manual maps |
| Flowcharts | Step-by-step logic | Medium | Processes, decisions, methods | Medium | Medium | Whimsical, Lucidchart, Miro |
| Cornell visual | Review and recall | Medium | Lectures, readings | Low | High | OneNote, Notion, paper notebooks |
| Bullet journal | Planning and progress | Slow | Habits, projects, course tracking | Medium | Medium | Paper, GoodNotes, Notability |
Table 2: Method selection guide for visual note-taking choices.
What to Look for in a Visual Note-Taking Tool
Pick the tool after you pick the method. The wrong surface can make a good method feel slow.
Atlas Recommendation and Freehand Guardrail
For research notes from PDFs or papers, Atlas is the source-grounded mapping option. For freehand/whiteboarding workflows, the recommended tools are Miro, Whimsical, or Obsidian Canvas.
| Need | Choose this kind of tool | Watch-out |
|---|---|---|
| Handwriting and live sketching | Paper, reMarkable, GoodNotes, Notability | Harder to search and reorganize later |
| Team workshops and whiteboards | Miro, Whimsical, FigJam, Lucidchart | Easy to overbuild a canvas instead of taking notes |
| Research papers and PDFs | Atlas or another source-grounded mapping tool | Not a replacement for freehand drawing |
| Long-term connected notes | Obsidian Canvas, Atlas, Heptabase-style spatial notes | Requires upkeep so maps do not become stale |
| Class review and exam prep | Cornell visual pages, mind maps, concept maps | Build review prompts into the page, not just pretty diagrams |
Table 3: Tool surface guide for visual note workflows.
Atlas fits one narrow slice of this tool-selection section. It is not the best tool for freehand sketching, whiteboard facilitation, or stylus-first notes. Use GoodNotes or paper for handwriting.
Combining Methods
The most effective visual note-takers don't stick to one method. They match the method to the material:
During a lecture: Start with a mind map to capture the main structure. Switch to flowcharts when the professor explains a process. Add sketchnote-style icons for memorable examples.
While reading a paper: Use concept mapping to capture the theoretical framework. Use a flowchart for the methodology. Summarize findings in a mini mind map.
When reviewing for exams: Convert your linear notes into mind maps (one per topic). Use the Cornell visual method for self-testing. Create concept maps to connect ideas across topics.
When synthesizing multiple sources: Build concept maps that connect ideas across papers. If the source pile is large, use Atlas to generate maps from your sources and discover links automatically.
Going Digital with Visual Notes
Paper visual notes have charm and cognitive benefits (the motor act of drawing aids memory). But digital tools add capabilities that paper can't match:
Searchability: Digital notes can be searched by text, even handwritten text with OCR.
Editing: Move, resize, and rearrange parts later. Paper fixes the layout once ink hits the page. App notes stay editable.
Source-grounded maps: Tools like Atlas can read notes and sources, then make mind maps that connect ideas. That helps with papers, PDFs, or saved web research. It is less useful when you want a blank canvas for live drawing.
Sharing: App-based visual notes can be shared and edited with other people. Whiteboard tools are strongest for live teamwork. Source-grounded tools are stronger when the map must stay tied to documents.
Scale: A paper mind map fills one page. An app map can hold many more ideas. Keep labels short and split crowded maps into smaller views.
Privacy: If your notes include client work, patient details, private research, or class material, check where the tool stores data. Also check whether sharing is on by default. Visual notes can expose context at a glance.
For a long-term visual knowledge system, combine these methods with a knowledge workspace. If you want AI to handle maps for source-heavy work, compare AI mind map generators.
Where Atlas Fits
Once you've picked a method, here are the tools that do each one well:
- reMarkable: a paper-like tablet for handwritten visual notes. Best when you want focus and low glare.
- GoodNotes and Notability: iPad apps for pen notes, shapes, search, and audio. Best for class and meeting notes.
- Apple Notes: the free option for quick sketches in the Apple ecosystem.
- Miro: a shared canvas for concept maps, flowcharts, and team boards.
- Obsidian Canvas: a free canvas for linking your own notes into a visual web.
- Atlas for source-grounded mapping: a source-grounded map tool for PDFs, web clippings, and notes that need cited links. Choose Miro, Whimsical, or Obsidian Canvas instead for freehand/whiteboarding workflows.
Match the tool to the method. Use reMarkable or GoodNotes for handwriting. Use Miro for team boards. Use Obsidian Canvas or Atlas for linked notes.
Where to Practice and Find Examples
Use examples before you invent your own style. The Indiana University visual note-taking guide collects sketchnote examples, books, and class resources. Verbal to Visual is useful when you want short lessons and video demos. Austin Kleon's public notes are useful when you want to see rough, real notes rather than polished templates.
If you learn better with a group, look for a workshop or community prompt. A good workshop gives you a talk, a time box, and feedback on whether your page communicates the main idea. A poor workshop only teaches icons.
Two common blockers are easy to avoid. If you think you cannot draw, start with boxes, arrows, stick figures, and labels. If you only have ten minutes, redraw one old page as a tiny mind map instead of starting a new system.
Adapt the Method to the Learner
The same method should not look the same for every learner. Use the table below as a quick adaptation check before you choose a layout.
| Learner or setting | Best adaptation | Why it helps |
|---|---|---|
| Multilingual learners | Use labels in both languages beside the same icon. | The icon anchors meaning while the two labels build vocabulary. |
| Neurodivergent learners | Use fewer branches, more white space, and one color rule. | The page stays easier to scan and less noisy. |
| Creative teams | Start with a shared whiteboard, then assign one person to clean the map. | The group can share ideas without leaving a messy record. |
| Recorded lectures or videos | Pause every five minutes and draw one small process, example, or claim. | The note becomes a set of checkpoints instead of a transcript. |
| Workshops | Compare two finished pages and ask what each page makes easy to remember. | Feedback focuses on the idea the page communicates. |
Table 4: Learner adaptation guide for visual note-taking contexts.
Getting Started: A Practical Plan
Week 1: Try mind mapping for one class or reading. Don't worry about making it look good. Focus on capturing the main topic and 4-6 branches.
Week 2: Try sketchnoting for a talk, video, or podcast. Practice the five basic elements (text, containers, connectors, icons, separators).
Week 3: Try concept mapping for a complex topic. Focus on labeling relationships between concepts, not just grouping them.
Week 4: Reflect on which method felt most natural and useful. Double down on that method, and use others situationally.
The goal isn't to master every method. It's to have enough familiarity that you can choose the right approach when it matters.
Atlas for source-grounded maps
Compare tools that turn PDFs, papers, and notes into source-linked mind maps.
Frequently Asked Questions
No. The most effective visual notes use simple shapes: circles, boxes, arrows, and stick figures. Sketchnoting pioneer Mike Rohde emphasizes that 'ideas, not art' are the point. If you can draw a circle and a straight line, you have all the artistic skill you need.