Knowledge Graph Software and Knowledge Graph Tools (2026)
Knowledge graph software and knowledge graph tools for enterprise data, RDF, GraphRAG, citation networks, research mapping tools, and citation network tools.
- Byline

Summary
Use knowledge graph software when data needs typed entities, relationships, provenance, and graph queries.
In 2026, compare Neo4j, Amazon Neptune, Virtuoso, Stardog, GraphDB, Graphiti, Zep, and FalkorDB first.
Neo4j fits property graphs, Neptune fits AWS-managed graph workloads, and Virtuoso or Stardog fit semantic data layers.
Use source-review tools before graph modeling when the source set still needs human review.

verifiable AI research workflow
Learn how to audit AI claims against sources before building a production graph.
Knowledge graph software stores facts as named items and links. Teams then query those links as graph data. The items can be people, products, policies, events, papers, or records. Teams use the graph to find paths, merge duplicate names, power search, and give AI systems a trusted data layer.
This guide focuses on graph databases and graph platforms. That includes RDF stores, semantic layers, GraphRAG memory systems, and hosted graph services.
Adjacent searches mention citation networks, research mapping tools, knowledge graph tools, and citation network tools. Those terms overlap with this topic. This page treats them as nearby research workflows. The main focus here is production graph data.
We compared Neo4j, Neptune, Virtuoso, Stardog, GraphDB, Graphiti, Zep, FalkorDB, pg-ripple, and Inferagraph. Each tool is scored on model, query layer, hosting, AI fit, controls, and cost. The first decision is the graph's job: database, meaning layer, search index, AI memory, or governed business data product.
What Is Knowledge Graph Software?
A knowledge graph shows links between nodes. In software, those nodes can be papers, people, products, policies, events, or records. The edges store the facts that connect them. A graph database or graph engine then lets teams query paths, clusters, identity matches, and source lineage.
How we tested: Each tool was scored on the same corpus and rubric. We scored graph-build effort, AI help, visual fidelity, linking depth, and price per query. Atlas is our product. We rank it where the data places it, with criteria set before scoring. See Atlas 2026 PDF AI Benchmark. The last test ran on 2026-04-15 by Jet New, founder of Atlas.
For enterprise work, knowledge graph software usually needs four layers:
- Data model: property graph, RDF triples, or a hybrid model.
- Query layer: Cypher, SPARQL, Gremlin, SQL extensions, APIs, or vector retrieval.
- Controls: entity matching, source trails, access rules, lineage, and update history.
- Use case: semantic search, fraud paths, customer 360, GraphRAG, or agent memory.
Mind maps, citation maps, and note graphs can help one person think. Enterprise knowledge graph software must also store, govern, and query graph data for teams and systems.
Graph Fit Test
In this review, the clearest split was not UI. It was the data model, query layer, deployment model, and AI use case.
Use the fit test before looking at pricing. A team building product features needs different tradeoffs from a team building a governed data layer or an AI context store.
| Criterion | Start here when | Good first tools |
|---|---|---|
| Property graph | You need paths, app logic, and Cypher-style queries | Neo4j, FalkorDB |
| RDF or linked data | You need SPARQL, ontologies, or standards-based data exchange | OpenLink, Stardog, GraphDB, Neptune |
| Cloud operations | You want the graph inside an existing AWS or managed cloud stack | Neptune, Neo4j Aura, Zep |
| AI context | You need retrieval, agent state, or GraphRAG context | Zep stack, Inferagraph, pg-ripple |
Table 1: Knowledge graph software fit criteria by data model, hosting model, and AI retrieval use case.
Query and Storage Fit
If you need a property graph with Cypher-style queries, start with Neo4j or FalkorDB. If you need RDF, SPARQL, or linked data, start with OpenLink, Stardog, GraphDB, or Neptune.
Hosting and AI Fit
If the graph must live inside AWS, start with Neptune. If the graph gives context to agents or GraphRAG, test the Zep framework, the Zep hosted service, Inferagraph, or pg-ripple.
Enterprise Data and AI Search
The current SERP for knowledge graph software centers on technical platforms. Use this group when you need an engine, database, or API layer rather than a visual note workspace.
The developer shortlist splits into three jobs. Neo4j and OpenLink store graph data. The Zep stack and Inferagraph help AI apps use graph context. pg-ripple keeps the work closer to Postgres.
Use this section when the graph is infrastructure. If the job is personal research, citation browsing, or visual note review, start with lighter research mapping tools instead.
Graphiti
Graphiti is an open-source framework from Zep for building temporal context graphs for AI agents. It tracks entities, facts, relationship changes, and provenance over time. Choose it when an agent must know what was true before, what changed, and where a fact came from.
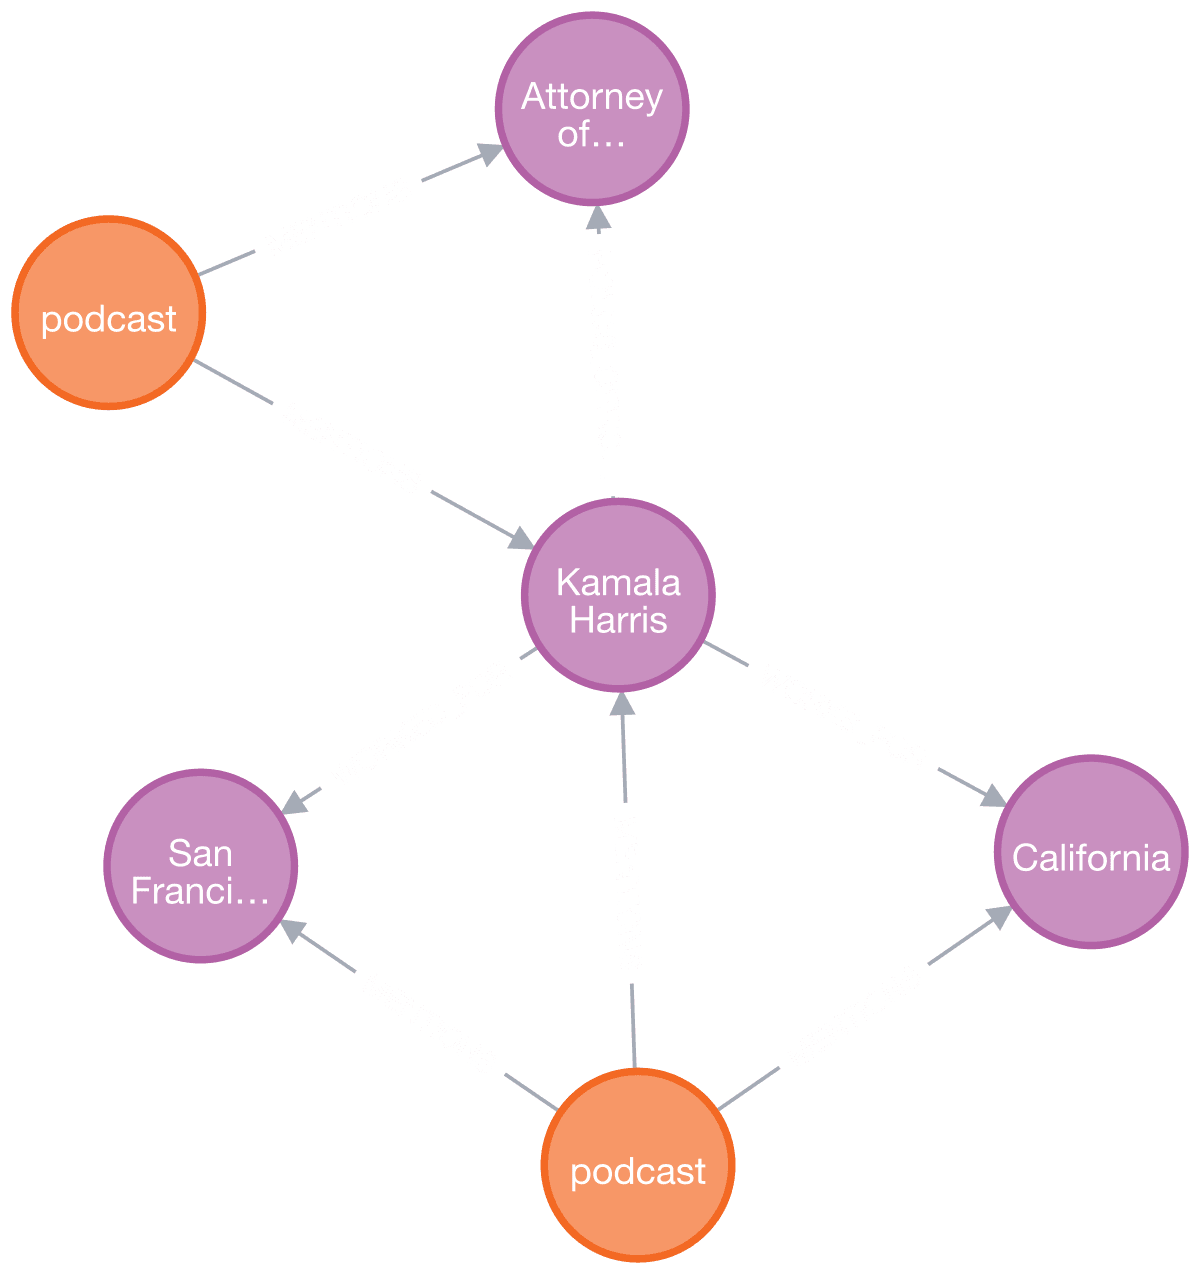
The project's own graph example from GitHub. It supports a quick read of how entities, facts, and labeled edges become context an AI app can retrieve later.
Zep
Zep is the hosted service built around the same framework. It fits teams that want context graphs, access rules, and retrieval outside the app code. Use the Zep documentation to check APIs, setup needs, and retrieval behavior before a pilot.
Virtuoso
OpenLink Virtuoso is a graph and RDF database with SQL support. It fits teams working with semantic web data, SPARQL, and data integration. Its product documentation is the right starting point for SPARQL and linked-data checks.
pg-ripple
pg-ripple is a Postgres-based project for graph and retrieval work. It fits teams that already use Postgres and want graph context before adding a separate graph database.
Inferagraph
Inferagraph is built around knowledge graphs for AI systems. Check it when the job is turning messy business knowledge into graph-backed search or reasoning.
Knowledge Graph Software Shortlist
1. Neo4j: Property Graph Applications
Neo4j is a graph database for nodes, edges, properties, and Cypher queries. Use it when your team can model the domain, write queries, and build the application views around a property graph. The Neo4j knowledge graph guide is a useful reference for this architecture.
Neo4j pricing includes a free community edition and AuraDB cloud plans.
2. Amazon Neptune: AWS Graph Workloads
Amazon Neptune is a managed graph database service for property graph and RDF workloads. Use it when your graph should live inside AWS with managed operations, IAM, backups, and cloud deployment patterns. Start with the Amazon Neptune user guide when you need to confirm supported graph models and query languages.
Pricing is usage based.
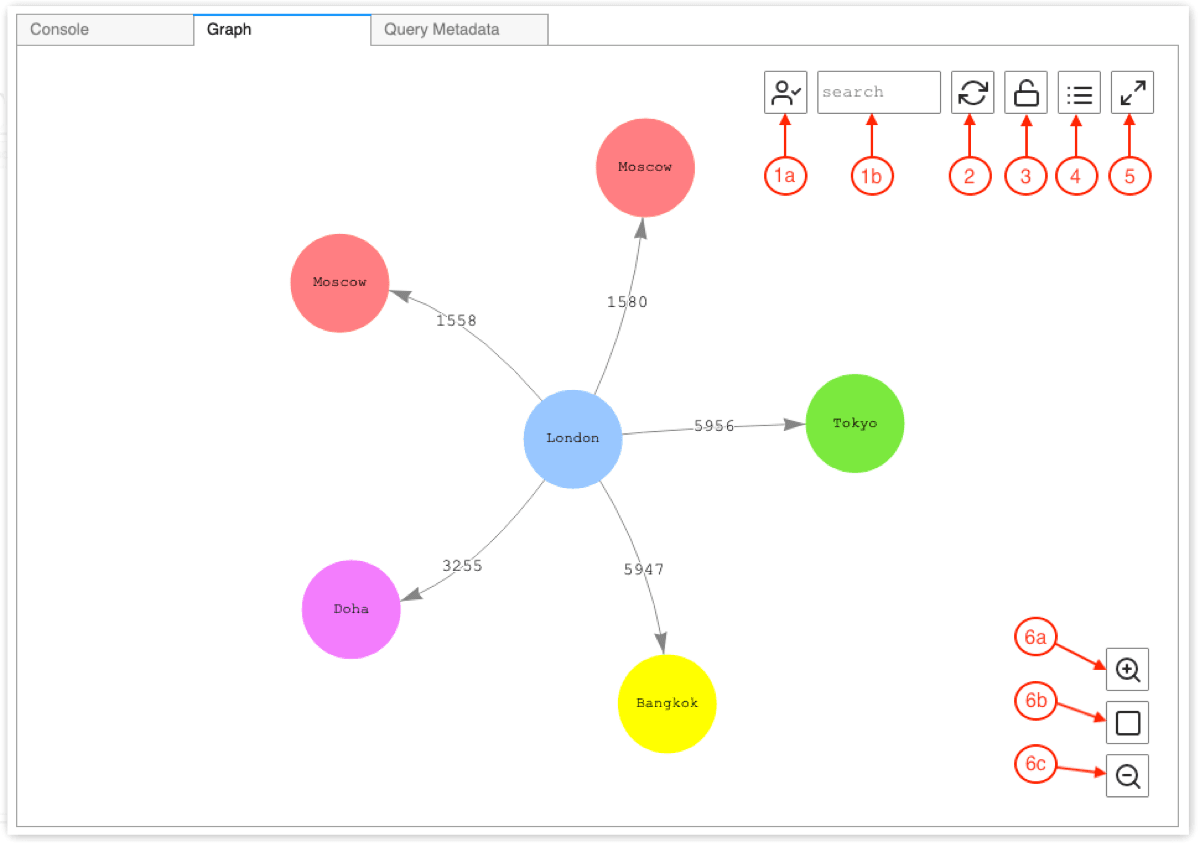
Amazon's Neptune documentation shows the graph tab inside Neptune Workbench. It supports visual query results, search, node details, physics controls, and zoom, which are practical checks when comparing managed graph databases.
3. Virtuoso: RDF and Linked Data
OpenLink Virtuoso is a graph and RDF database with SQL support. Use it when SPARQL, RDF, and data integration matter more than a simple visual graph.
Pricing includes open-source and commercial editions.
4. Stardog: Enterprise Semantic Layers
Stardog focuses on knowledge graphs, semantic data layers, and data access across many systems. Use it when teams need a governed meaning layer. The Stardog platform page is the primary source for its semantic layer and virtualization claims.
Pricing is quote based.
5. GraphDB: RDF Repositories
GraphDB from Ontotext is built for RDF data, semantic search, and knowledge graph repositories. Use it when the graph is mainly RDF and the team needs mature SPARQL tooling. Check the GraphDB product documentation before testing repository setup, imports, and semantic search.
Pricing includes a free edition and commercial plans.
6. Graphiti: Temporal AI Context Graphs
The open-source Zep framework tracks entities, facts, changes, and provenance over time. Use it when an AI agent needs context that knows what changed and when.
Pricing is open source, with hosting costs.
7. Zep: Managed AI Memory
Zep is the hosted service built around that framework. Use it when production AI apps need graph context without a self-owned stack.
Pricing is plan or usage based.
8. FalkorDB: Redis-Compatible Graph Workloads
FalkorDB is a graph database that grew from RedisGraph. Use it when teams want graph queries close to Redis-style infrastructure or GraphRAG experiments. Its open-source repository is the most direct source for current query support and deployment notes.
Pricing includes open-source and cloud options.
Feature Breakdown
Use these groups to compare graph software by model, query layer, hosting, and AI fit.
| Tool | Model | Query or access layer | Primary fit | Pricing model |
|---|---|---|---|---|
| Neo4j | Property graph | Cypher, APIs | App teams building graph-backed products | Free, cloud, and enterprise plans |
| Amazon Neptune | Property graph and RDF | Gremlin, openCypher, SPARQL | AWS teams that want managed graph infrastructure | Usage based |
| Virtuoso | RDF, SQL, graph | SPARQL, SQL, linked data APIs | Semantic web and linked-data teams | Open-source and commercial editions |
| Stardog | Enterprise semantic layer | SPARQL and virtual graph access | Governed data layers across many systems | Quote based |
| GraphDB | RDF repository | SPARQL and semantic search | RDF repositories and semantic search | Free and commercial editions |
| Graphiti | Temporal context graph | Python framework and graph APIs | AI-agent memory with source trails | Open source |
| Zep | Hosted AI memory | Managed memory APIs | Production AI apps that need hosted graph memory | Plan or usage based |
| FalkorDB | Property graph | Cypher-style queries | Redis-adjacent graph and GraphRAG work | Open-source and cloud options |
Table 2: Knowledge graph software comparison by model, query layer, primary fit, and pricing model.
- Property graph tools: Neo4j and FalkorDB use nodes, edges, properties, and Cypher-style queries.
- RDF and semantic platforms: Virtuoso, Stardog, GraphDB, and Neptune support RDF or SPARQL.
- Cloud graph services: Neptune and Neo4j Aura reduce ops work for cloud teams.
- AI context and GraphRAG tools: the Zep stack, pg-ripple, and Inferagraph focus on retrieval and agent state.
- Governance needs: Stardog, Virtuoso, GraphDB, and Neptune fit teams that need source trails, access rules, and lineage.
Pricing Model
Pricing depends on setup model, support level, and data size. Open-source graph tools shift cost to hosting and staff time, while cloud services charge by use or contract. Treat pricing as part of the pilot plan, because query volume, storage, backups, and graph analytics can change the real monthly cost.
- Neo4j pricing is a useful first benchmark. It spans free community use, Aura cloud, and enterprise plans.
- Neptune pricing is usage based. Model instance size, storage, I/O, analytics, and backups before a pilot.
- OpenLink, Stardog, and GraphDB pricing depends on edition, support, data size, and enterprise features.
- The Zep framework, FalkorDB, and pg-ripple are open source, but hosting and staff time are still real costs.
- Price hosted AI graph tools against the pilot workload, contract terms, and support requirements.
Choose the Right Graph Tool
Pick the tool by the work it must do. First decide whether you need a graph store, meaning layer, search index, app backend, or AI context layer. Then check storage, export, and link upkeep.
Use this checklist before a pilot:
- Data model: decide whether facts are business entities, RDF triples, events, or AI memory.
- Query layer: pick Cypher, SPARQL, Gremlin, SQL, or API-only access before vendor selection.
- Source trail: require a source record, time, and confidence score when auditability matters.
- Hosting: decide whether the graph must live in AWS, self-hosted infrastructure, or a vendor cloud.
- AI use: separate search, recommendations, fraud paths, and agent context before the pilot.
- Exit path: confirm that you can export nodes, edges, RDF, or database dumps.
By your technical comfort level
-
Data teams new to graph should start with Neo4j or Amazon Neptune and model one high-value domain first.
-
Linked-data teams should compare OpenLink, Stardog, and GraphDB before choosing a property-graph store.
-
AI app teams should test the Zep stack, FalkorDB, pg-ripple, and Inferagraph with one retrieval workflow.
By your use case
-
For property-graph apps, Neo4j and FalkorDB fit teams that need queryable nodes, edges, and properties.
-
For RDF and linked data, OpenLink, Stardog, GraphDB, and Neptune fit teams that need SPARQL or formal models.
-
For developer and AI-agent systems, the Zep stack, OpenLink, pg-ripple, Inferagraph, and Neo4j fit this lane. Choose them when the graph is infrastructure for an app, search layer, or agent context.
-
For shared enterprise graph work, Neo4j, OpenLink, Zep, and cloud graph platforms are the main fit.
-
For pre-modeling source review, use a lighter research map before the team turns facts into graph data.
By what you want to invest
-
Low engineering effort means a cloud service such as Neptune, Neo4j Aura, Zep, or a vendor platform.
-
Medium effort means GraphDB, OpenLink, Stardog, or FalkorDB with a focused pilot.
-
High effort means the Zep framework, pg-ripple, or a custom graph-plus-vector stack.
-
Major time investment means Neo4j or another developer platform. You model the domain, write queries, and build custom views.
Pilot Data and Deployment Requirements
Use a small pilot pack before you compare vendors. In our rubric, a useful pilot has 200-500 entities, 5-10 relationship types, and three queries that the current search stack cannot answer.
A pilot should prove both data fit and team fit. The best tool on paper is the wrong choice if imports create duplicates, exports are weak, or the team cannot write the queries it needs.
- Input formats: include a table export, a document set, and a single existing ID system. This tests structured data, messy text, and entity matching.
- Required fields: keep entity ID, entity type, source URL or file, relationship type, timestamp, and confidence score.
- Deployment model: test one managed option and one self-hosted option if security rules allow it. That shows the real gap in setup work.
- Import test: load the same pilot pack twice. Duplicate nodes after the second import expose weak merge rules.
- Query test: write one path query, one provenance query, and one freshness query. These prove whether the graph is more useful than keyword search.
- Exit test: export nodes and edges before the pilot ends. If export is hard in week one, it will be harder after rollout.
Checks Before You Commit
Use these checks before you move a real project into any knowledge graph tool:
-
Start with one project, one course, or one research topic. The tool should feel clear before you import years of notes.
-
Test linking work. A tool that needs manual links should make that work fast enough to repeat each week.
-
Check export paths. Local Markdown, CSV, RDF, or database dumps matter if the graph will live for years.
-
Check source grounding. If AI builds the graph, each claim should trace back to your papers, notes, or records.
-
Check the graph view under load. Add 100 items, then see whether search, filters, and zoom still help.
Enterprise Knowledge Graph Failure Modes
These failure modes recur when teams treat graph software as a visual layer instead of a data system. Check them before rollout, because each one gets harder to fix after teams build dashboards or AI workflows on top.
Duplicate Nodes
Weak entity resolution creates duplicate nodes. The same customer, author, or policy appears under several names. Fix this before rollout with match rules, review queues, and merge logs.
Missing Provenance
A graph is hard to trust when facts have no source record. Require each edge to keep its source, time, and confidence level so teams can audit important claims.
Stale Relationships
Stale relationships create bad answers. Product, legal, and customer facts change. Use temporal fields or update windows so the graph can show what is true now and what was true before.
Final Recommendation
Run a 30-day proof of concept before vendor selection. Pick one domain and model 200-500 high-value entities. Define source trails for each edge. Then test three queries that the current search stack cannot answer. For AI-facing graphs, use a verifiable AI research workflow so each generated claim keeps a source trail.
verifiable AI research workflow
Learn how to audit AI claims against sources before building a production graph.
Frequently Asked Questions
A knowledge graph is the modeled set of entities, facts, and relationships. A graph database is software that stores and queries that graph. Neo4j, Amazon Neptune, Virtuoso, Stardog, GraphDB, and FalkorDB are graph database or graph platform options.