

Multistage sampling chooses a sample through a sequence of nested units. A study might first choose schools, then classes within those schools, then pupils within those classes. To interpret the design, trace what was selected at each stage and how it became the frame for the next draw.
The phrase “multistage random sample” can hide an unclear step. A random school draw does not tell you how teachers chose pupils. A stage map helps you keep the reported sequence and the missing rules in the same view.

Reconstruct a study's sampling stages
Keep the selected units and next-stage rules tied to their sources.
What makes a design multistage
A stage is a round of selecting units inside those reached at the prior stage. Districts can contain schools, schools can contain classes, and classes can contain pupils. The final units are the ones the study measures.
Statistics Canada's probability sampling guide distinguishes this nested design from choosing a cluster and including all its units. Further selection within the chosen clusters creates additional stages.
The point is often practical. A researcher may have a school list but no state-wide pupil list. After selecting schools, the team can obtain class or pupil lists only where it will work. The FAO sampling manual discusses stage-specific frames and concentrating fieldwork.
This can reduce the work of building a complete list of final units. It does not remove the need for a usable frame at each relevant stage. A missing school from the first list cannot contribute pupils later in the sequence.
Identify the unit at each stage
The Berkeley sampling text illustrates nested selection through housing units and residents. The same logic applies when the actual units are farms, clinics, or businesses.
Read the method verbs rather than only the labels. “We chose districts,” “we listed schools,” and “we contacted head teachers” describe different actions. Listing a unit is not yet selecting it, and asking for access is not yet drawing participants.
For each draw, record the eligible list, chosen unit, selection rule, count, and next-stage list. Keep a source location beside each fact. A sentence that mentions three levels may still omit one of the draw rules.
The first selected unit is called the primary sampling unit. A school can fill that role in one study, while a district fills it in another. Do not assign the label from the unit's size or importance alone.
Original university guidance makes the nesting relationship explicit. Your map should follow that relationship, rather than imposing the labels from a different survey.
Strata can appear inside the design too. A team may group districts by region before drawing districts from every region. The regions organize that draw into strata. The stratified sampling guide explains how grouping and selection differ.
A fixed-step draw can also occur within a stage. If the report takes every fifth household, read the starting rule and list order. The systematic sampling guide addresses those checks.
Worked school survey stage map
This example is fictional. A report says the team randomly chose 8 schools from a district list. It then randomly chose 2 classes in each school. Teachers provided 10 pupils per class, but the excerpt does not say how they chose those pupils.
The stage-selected-unit-next-stage evidence map below captures the stated rules and the gap. Its invented counts let you trace the sequence without prescribing sample sizes for a real survey.
| Stage | Frame and chosen unit | Reported rule | Next step or gap |
|---|---|---|---|
| 1 | District school list; 8 schools | Random school draw | Obtain class lists in chosen schools |
| 2 | Lists within chosen schools; 2 classes each | Random class draw | Obtain eligible pupil lists in chosen classes |
| 3 | Pupils within chosen classes; 10 each | Teachers supplied names | Pupil-selection rule is not reported |
Table 1: The map describes two reported random draws and one unresolved final rule.
If all 8 schools supplied 2 classes and each supplied 10 pupils, the planned final count is 8 × 2 × 10 = 160. That is a count of planned pupils. It does not show how many consented or completed the study.
The first two stages do not establish that the final 160 pupils form a probability sample. Teachers might have drawn names at random, chosen available pupils, or applied another rule. The excerpt leaves those possibilities open.
The official probability sampling explanation ties a probability sample to chance-based selection. Your note should ask for the final rule rather than supplying one from the article's title.
If access drove the final step, the convenience sampling guide helps document that limitation. The earlier random draws still happened; they just do not settle the whole design.
A corrected note might read: “Schools and classes were randomly selected. The final pupil rule is not stated. The excerpt supports a three-stage sequence, but not a fully specified probability sample.”
Check probability and analysis claims
A probability design needs a probability selection procedure at every stage. Units need not have equal chances, but those chances must follow the design. “Random” at the first stage alone does not establish them for the final units.
The FAO manual explains why sampling and estimation methods belong together. A source-reading map helps you understand the sequence. Calculating weights and standard errors requires the full design and a suitable statistical method.
People in one school may share experiences that differ from those in other schools. A design-aware analysis considers such clustering. Do not treat the final head count as equivalent to the same number of independent draws from one complete pupil list.
If the paper names weights, strata, or cluster variables, find the analysis passage that explains their use. A software name identifies the tool; reconstructing the procedure also needs the analysis rules. The methods-section guide helps locate what was done and why.
Keep sampling stages distinct from study visits. Measuring the same pupil twice adds a time point while retaining the chosen pupil. If the team draws a subset for a second round, find the rule for that draw; the timeline alone cannot explain it.
When appraising an observational report, a reporting checklist can help you find selection and analysis details. A checklist does not certify that the stated design was carried out correctly.
Compare the stage descriptions in Atlas
Add the published methods, sampling appendix, and relevant guidance to one Atlas project. Use material you have permission to share. Published descriptions supply the evidence needed to trace the stages without uploading identifiable participant records.
Open a chat and use @ to name the methods and appendix. Ask: “Reconstruct each selection stage. Name the frame, chosen unit, count, draw rule, and next-stage frame. Give the source passage for each and mark any rule that is missing.”
The inspected capture below shows a paper alongside a cited answer. It illustrates checking source context. It is not a screenshot of the fictional school study, a stage map, or a sampling tool.
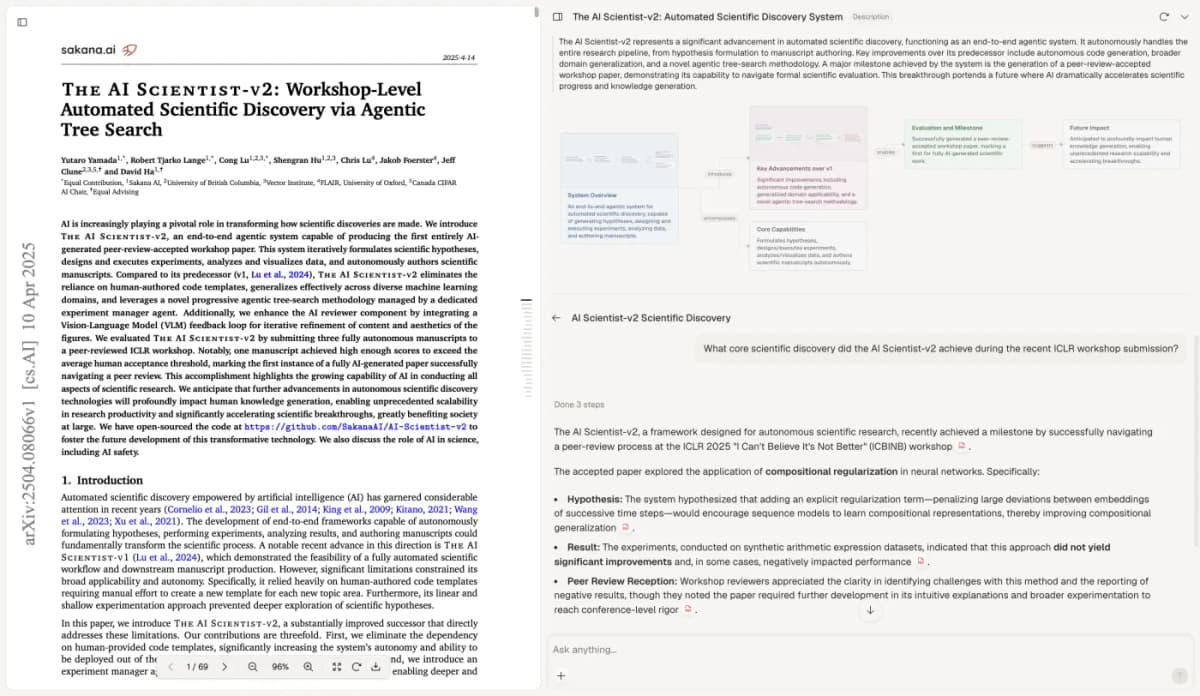
Open a citation and compare the answer with the actual method passage before keeping a stage rule.
The visible paper is The AI Scientist-v2 by Yamada et al., licensed under CC BY 4.0. This Atlas screenshot is reused unchanged.
Suppose Atlas calls all three draws random. Open the teacher passage. If it only says teachers supplied 10 names, remove the random-draw claim for stage 3. Ask again for the exact wording and keep the final rule unresolved.
Create a note through New → Note and save the corrected map. Add source locations and the follow-up needed: “Find the teacher instruction for choosing pupils.” Wait for Saved before closing the note.
For several studies, the research synthesis workflow helps keep the same questions across reports. Compare stages with stages; do not merge school counts and pupil counts into one sampling field.
Save the map and open questions
A complete reading note names the sequence, reported rules, missing rules, and completed response counts. It also records where the analysis describes the design. Each statement should have its own supporting location.
Return when the full appendix arrives. If it supplies a random pupil rule, update stage 3 and the conclusion it changes. If it reports available pupils, retain that limitation without erasing the earlier random stages.
Reconstruct a study's sampling stages
Keep the selected units and next-stage rules tied to their sources.