

Stratified sampling splits a population into groups, called strata, and takes a probability sample within each group. To read a study's design, find how units entered each group and how the researcher chose units inside it.
A report may give group counts without explaining the draw. It may describe a random draw but leave the frame unclear. Keep both questions in your methods note, so a familiar label does not stand in for the missing steps.

Check a reported stratified design
Keep the grouping rule and selection evidence together.
What stratified sampling does
Imagine a staff survey with three job groups. The researcher splits the staff list by job before drawing the sample. Each person belongs to one stratum, and each stratum supplies some people for the survey.
Statistics Canada's methods account sets out the main rule: the groups cover the frame without overlap. The choice of groups, sample counts, and draw method are separate decisions.
Stratification can help a study get enough data about a small group. It can also improve precision when the group rule is useful for the outcome. These are possible gains, not a promise that any grouped sample will work well.
Read the stated draw rule. The APA definition includes random and systematic selection within strata. A study need not use a simple random draw in every group to have a stratified design.
Find the grouping and selection evidence
Start with the people or units the study aims to describe. Then find the list it used. A staff register covers staff on that register. Splitting the list by job does not add staff who were left off it.
Build a stratum-within-stratum-selection evidence table from the paper and its appendix. Add page or section locations to your own copy. If a step is missing, keep it as an open question.
| Report detail | Evidence to find | What it supports | What stays separate |
|---|---|---|---|
| Group rule | Definitions and assignment date | Who belongs in each stratum | People outside the target frame |
| Frame count | Eligible units per group | Each group's frame share | Coverage beyond the list |
| Draw | Method and sample count per group | How units were chosen | Who responded afterward |
| Analysis | Weights and variance method | How the design enters estimates | Whether the method was used correctly |
Table 1: The table keeps reported facts apart from the further checks needed to judge an estimate.
“We chose 40 people from each region” gives counts. It does not tell you whether names came from a random draw or from the first willing volunteers. Look for the recruitment passage before calling it stratified random sampling.
The official probability sampling guide explains why selection chances matter. Group targets alone do not supply those chances.
Keep invitations and replies separate. If one group received 40 invitations and returned 18 replies, record both. Replacing the first count with the second can hide who dropped out after the draw.
If the report gives too little detail, ask for the full methods appendix. The research appendix guide can help you look for material that supplements the main text. Do not fill a gap with a guessed procedure.
Worked example with unequal groups
This is an invented example, not a study result. A survey frame has 1,000 staff: 600 in operations, 300 in office roles, and 100 in tech support. The plan calls for 100 selections.
Proportional allocation gives the three groups 60, 30, and 10 selections. Each draw covers one in ten staff in its group. These counts set the sample sizes; they do not tell us how the names were drawn.
Now suppose the researcher wants more detail about tech support. The plan takes 30 names from each group, for 90 in total. The fractions are 5%, 10%, and 30%. Equal counts have given staff unequal selection chances.
Tech support now makes up one third of the sample, though it makes up one tenth of the frame. That can help a subgroup comparison. It also means a plain average across the sampled staff gives this small group more influence than its frame share.
To see the effect, assume full response and equal selection chances within each group. Let the three group means on a score be 20, 40, and 80. These are made-up scores for the example.
Weighting those means by the frame shares gives 0.6 × 20 + 0.3 × 40 + 0.1 × 80 = 32. Giving the three means equal weight gives about 46.7. The two sums answer different questions because the groups have different influence.
The original methods publication shows how group sizes enter a population total. A real study may also need to account for nonresponse and other design features.
Do not turn this simple example into a complete survey estimator. Ask which overall quantity the paper reports and where it explains the weights. A count table cannot answer that question by itself.
A checked note could say: “Equal allocation raised the small group's share of the sample. I need the analysis method before I interpret the overall score.” It should not say that equal allocation preserved the frame's group proportions.
Separate strata from quotas and clusters
If the rule takes every tenth name, the systematic sampling guide explains the start and list-order checks. The groups tell you where draws take place; the rule tells you how they take place. Keep both details in the note, with the source passage for each step.
A quota can use the same labels as a stratum. But filling group targets with available volunteers does not establish random selection within groups. The MacEwan sampling chapter distinguishes the logic of probability and non-probability methods.
If access drove recruitment, the convenience sampling guide helps you trace who was easy to reach. Similar group counts can arise from very different ways of choosing people.
Clusters use groups differently. A basic cluster sample chooses some groups and observes their units. A stratified sample draws within every stratum. Statistics Canada explains the distinction.
A study can combine designs. It might group schools by region, choose schools within regions, and choose pupils inside those schools. Regions are strata; schools and pupils are units at successive stages.
The multistage sampling guide shows how to trace that sequence. Do not call every group a stratum just because the report contains more than one level.
Check the methods passages in Atlas
Use Atlas when the needed details sit across methods, a frame appendix, and guidance. Add material you have permission to use to one project. Published methods and anonymized descriptions are enough for this source-reading task.
Open a chat and use @ to name the methods and appendix. Ask: “How does this study define strata and choose units within each? Give the source location for each step. Separate sample counts, draws, replies, and weights. Mark gaps.”
The inspected Atlas capture below shows a paper beside a cited answer. It illustrates the step of checking source context. The displayed paper is about another topic; it does not document the invented staff survey.
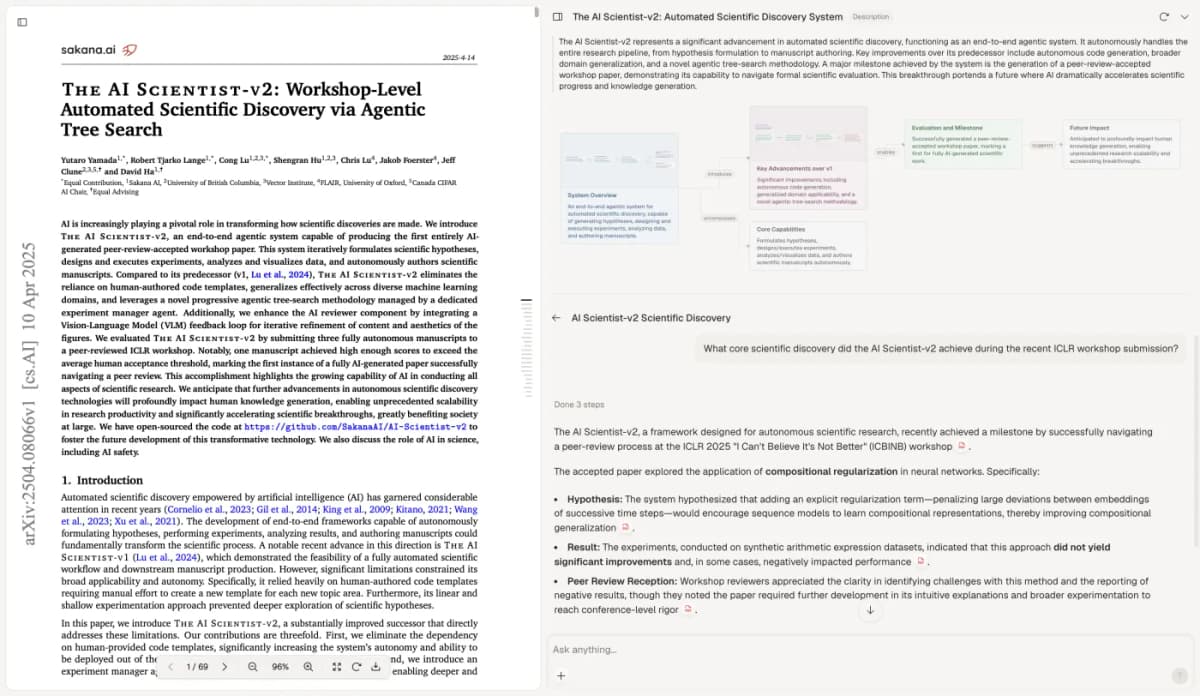
Open the cited material and check its wording before keeping an interpretation of the sampling design.
The visible paper is The AI Scientist-v2 by Yamada et al., licensed under CC BY 4.0. This Atlas screenshot is reused unchanged.
Suppose the answer says equal allocation preserves group proportions. The passage only says 30 names were drawn per group. That supports equal counts, but not the claimed proportions. Correct the note from the frame counts.
If a citation opens the whole document, find the section yourself. If no passage explains the weights, leave that field unresolved. A citation helps locate material; the reader still checks whether it supports the answer.
Create a note through New → Note. Keep the reported rule, source location, correction, and open question. Wait for Saved before closing it. The research synthesis workflow helps extend the same checks across several papers.
Keep a bounded conclusion
Your final note might say: “The frame defines three exclusive job groups. Equal counts came from groups of unequal size. The draw is described, but this excerpt does not explain weights or response adjustments.”
That note supports an explanation of allocation. It does not yet settle whether the overall estimate is sound. When a full appendix arrives, add the new passage and revise the claim it changes.
Check a reported stratified design
Keep the grouping rule and selection evidence together.